Anchored Model Layering • Zettelkasten Method

 Anchored Model Layering • Zettelkasten Method
Having an idea is not the actual eureka moment. It is the long work that follows. Anchored model layering is a tool for that work: relate many overlapping models to each other through a shared anchor, and you get one meta-model you can keep extending across long thinking sessions.
Howdy, Stranger!
Categories
- 3K All Categories
- 153 Research & Reading
- 707 The Zettelkasten Method
- 12 Knowledge Work
- 102 Writing
- 474 Software & Gadgets
- 160 Workflows
- 733 The Archive
- 15 Plug-In Showcase
- 88 Resolved Issues
- 225 Projects Logs and Journals
- 86 Project: Zettelkasten.de
- 53 Critique my Zettel
- 179 Random
- 375 Introduce Yourselves!
Comments
Extremely insightful and helpful on a conceptual level.
Thanks!
I am a Zettler
Interesting post.
I had to look up "eureka moment". I learned the story of Archimedes' insight. When he got into the bath, he noticed the water level rise and suddenly understood something new about the physics of water displacement. He euphorically cried out "Eureka!" ("I have found (it)"). This sudden realization is also known as an Aha! moment, when you think or say "Aha! Now I get it." Some people use the metaphor of a lightbulb lighting up in the moment they have the idea. 💡
I'm trying to connect the post's concepts to previous knowledge. The idea that we need to "earn" an idea or should try to "fully grasp" an idea reminds me of the The Complete Guide to Atomic Note-Taking.
The term "model" seems to refer to one of the six types of knowledge building blocks mentioned in The Guide.
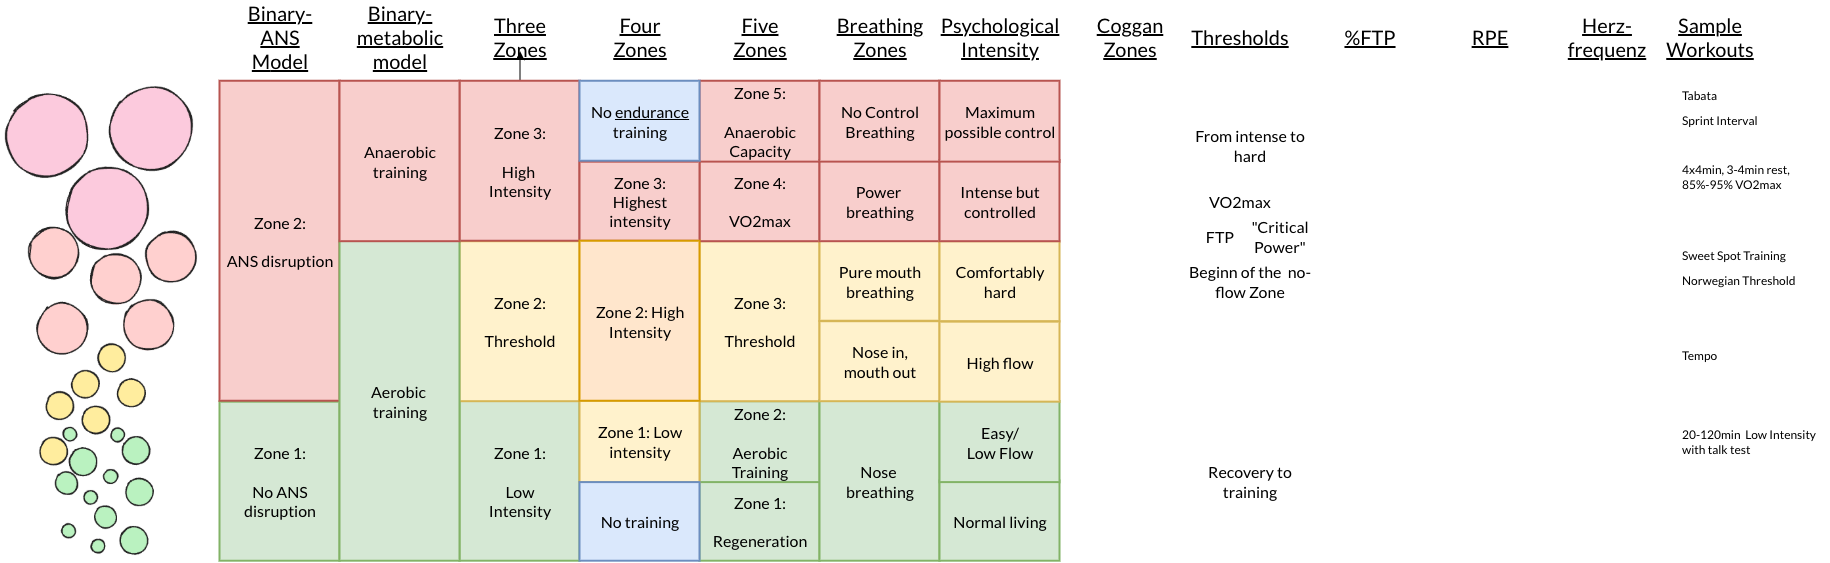
However, I don't understand where "meta-model" fits in. The chart doesn't look like an atomic note that represents an atomic idea, but like a structure note that links various atomic notes about models for the purpose of comparison.
The "anchor" reminds me of a tertium comparationis. What is it that the compared things have in common? In this case it seems to be a scale of "endurance intensity".
The "anchor" also reminds of a hypothesis. What phenomen does the comparison examine? In this case the hypotheses seem to be:
The "persistent effort to think about one problem or idea that spans multiple long thinking sessions" reminds me of a project. In this case maybe a research project about intensity thresholds in endurance training?
The visualization reminds me of a table: one model per column, one intensity level per row. I find such comparison tables useful as simplified overviews of my current understanding of a research interest.
In Obsidian I'd use a Markdown table, because Markdown is quick to update and easy to link.
It's a metamodel because it's a model that allows to express other models, such as the endurance model developed in the article
I'm trying to make this compatible with atomic notes, structure notes and the six default knowledge building blocks.
Where does such a "meta"-model sit? And do we really need to introduce a "meta"-model, if we just want to express what the post expresses?
I think we're dealing with a straightforward structure note that compares simple models along one discrete axis.
In my mind, the own model is just another model. If we add it explicitly as another column to the table, I don't see the need for anything "meta".
Once the column is added, it becomes easy to make details of the own model explicit. Does it have three levels or six levels? I don't know. I chose the labels 1a/b, 2 a/b, 3a/b as a compromise that assumes two major thresholds and still allows to label all six rows. What would be better labels for the 3 or 6 levels? I don't know. But I'd know where to put them in the table.
Thinking of it as a simple comparison table allows you to add multiple versions of your own model. This makes it easy to try out different labels or attributes for each level.
It depends on how you intend to treat it in your Zettelkasten.
If in your Zettelkasten you want to discuss, describe, or reflect on this meta-model, I think it boils down to being treated as a model represented within your Zettelkasten.
On the other hand, if you want to use it alongside, in support of, or as a tool for your Zettelkasten, it isn't something that falls under individual "blocks", but rather a cognitive tool for tackling a subject. Comparable to the principle of atomicity, for instance.
Yes, I think we can compare it to the concept of structure notes. At the end of the day, it's a tool that supports building a sort of map of a knowledge domain. It allows you to bring together and compose other ideas/thoughts into a coherent composition that makes sense as a whole.
In my opinion, as a concept, this meta-model (and I believe it can be considered a mental model, and there are some discussions about mental models in the forum) is analogous to a Structure Note. It's something that allows you to organize and compose thoughts into a structure that makes overarching sense. Perhaps more specialized for a specific function.
Yes, that's a useful distinction.
Yes, in this case the "meta"-model would just be another model.
Yes, that's the primary use case I have in mind. Structure notes or project notes as a tool to keep an overview.
(skipped)
Yes. That's what I had in mind with the comparison table.
I think the post only describes a pattern for structure notes. I don't see a mental model that would justify the term "meta-model".
If you can see more than a simple comparison, what is it? How do you interpret the "anchor" metaphor?
@harr I don't have much time right now to write a more articulated reply, unfortunately, so I may come back to this later.
I do consider it a mental model (although, in the end, I would argue that a structure note is also a mental model, too), because it addresses a specific need, integrating multiple different models into a single overarching view, as shown in the example with the training thresholds, and provides a way of approaching and solving that problem. And I think this is the reason of mental models existence, s I understand them: you have a specific type of problem, and a mental model provides you with a mental operational framework for tackling it.
The use of reference axes and the tabular representation are two of the tools provided by this mental model.
I also think "meta" is meaningful here, in addition to "mental", because the model can itself be used to work with other models (the endurance model in the example is a model, indeed), which were constructed using the usual tools for building models. The meta-model provides a way to take those independently developed models and bring them together within a common structure, making their relationships and differences explicit.
So I don't necessarily see "meta-model" as something that has to become a new kind of Zettelkasten building block. I see it more as a cognitive tool for working with models. The resulting table may indeed be a structure note, but the underlying method for constructing and using that table is a different level of abstraction.
Then you can consider how to physically implement it in the form of notes.
I think your idea of simply using a table is valid, and perhaps the most natural approach, too.
Personally, I was thinking to try using a "structure note," perhaps designed in a specific way. But it's something to test.
One thing worth pointing out, though: if you really think about it, is that if the entries in your Obsidian table are links, the table itself effectively becomes a structure note. After all, there’s no requirement for a structure note to be formatted as a list or a tree.
Recalling what I've just written:
I also think it is worth developing the point that a Structure Note itself can be seen as a mental model.
If I have a specific need, for example, I have a number of related ideas and I need to see how they fit together as a whole, the concept of a Structure Note gives me a way to address that need. It tells me, in a sense, how to approach the problem: bring together the relevant ideas and organize them into a meaningful structure.
So, in this sense, the Structure Note is not merely the resulting note or the particular structure I create. The concept of "Structure Note" itself provides a cognitive model for dealing with the need for orientation and organization within a body of knowledge.
This is also how I see the Anchored Model Layering approach. There is a specific need: integrating several different models into an overarching view, and the concept provides a way to approach that problem. And the resulting table is one possible implementation of that approach.
This is why I see a parallel between the two: the Structure Note is a more general cognitive tool for organizing ideas, while Anchored Model Layering is a more specialized cognitive tool for organizing and relating models. And, as I've written above, Anchored Model Layer, if made with links, can behave exactly as a structure note :-)
The integration of models into an "overarching view" is the part that works for me. The chart lets me see several models together.
But I'm not seeing where the next step happens. What exactly is the "anchor" in the example? Where is the common scale defined and labeled? What are the common entities? Where are the models being integrated into a meta-model—a model of models?
If I understood it correctly, the anchor in the example is the vertical axis.
More precisely, the common dimension of training intensity represented by that axis. It remains the same across all the models shown in the chart. The figure on the left can be divided, more generally, into different intensity bands.
Sascha chose a graphical representation for this, that circles, evidently one that works well for him, but the same thing could also be represented textually or in a table.
The different training models essentially share the idea that training can be divided into zones corresponding to different levels of intensity. By trying to place the concepts from each model at their "appropriate height" on this common scale, you can see relationships between them. For example, you can see that the "aerobic training" zone in one model roughly corresponds to Zones 1 and 2 in another model, and so on. (I'm familiar with only a few of them, used in running, I don't know them all).
Perhaps some of the difficulty comes simply from not being very familiar with the specific training models used in the example. :-)
Perhaps a cooking example makes the idea easier to see.
Imagine that I want to compare different ways of describing how well-done a steak is.
These are different models describing the same phenomenon.
I can choose degree of doneness as the common dimension, the anchor, and place the concepts from each model along that dimension. I can then add my own model, perhaps with just undercooked / just right / overcooked, and place those categories on the same scale as well.
The resulting table or chart allows me to see how the different models relate to one another.
So the meta-model isn't another model of how to cook a steak. It is a way of working with multiple models of the same subject: identify a common dimension, use it as an anchor, and layer the different models onto it.
That's what I mean when I say that the "meta" aspect is meaningful: the model operates on other models (domain of cooking knowledge, in this case).
I think this also addresses the question "Where are the common entities?" quite well: the entities are the concepts from the individual models (rare, medium-rare, medium, etc.) while the anchor is the dimension along which those entities can be mapped to one another (degree of doneness, common to all scales)
Nice example. :-)
I did some reading about visualizations, where the term anchor is used differently. The horizontal lines represent anchor values as reference values. The first column defines those anchor values. Note that, unlike in a table, values of the second column don't have to match the anchor values. They are drawn relative to the anchor values. The vertical line is not the anchor, but the common scale (tertium comparationis). The columns are anchored on the horizontal lines. (I hope this makes sense.)
I don't think of "rare" or "medium-rare" as concepts, but as a value ranges on a scale. The models differ in a) how they determine the degree of doneness and b) in how they label ranges. The interesting information in the visualization is where those ranges sit relatively to the anchor values.
I think the biggest challenge lies in finding a proper definition of "degree of doneness" that provides reliable reference/anchor values. "Just right" is obviously nonsense. :-) A chemical or physical marker that can be measured objectively would make more sense.
Here is another example for a visualization with a common scale and well-defined anchor values:
Similar to the cruder comparison table shown earlier, I consider this visualization not a "meta-model", but a simplified comparative overview of what we currently know about our research topic.
Variables like these are called "linguistic variables" and they constitute a partial ordering. This means that any axis is ordered but the ordering only applies for that axis. Values drawn from one axis cannot be ordered against values from another. Fuzzy logic provides an approach for working with linguistic variables.
Here are other examples of charts that use a particular value or threshold as anchor.
This chart from an open-access article is captioned (emphasis added): "Alignment of the 3- and 5-zone scales anchored by two common lactate/ventilatory turn points (black dashed lines) defining a threshold region (yellow). (…)"
Note the fuzzy shading of the zone borders.
This chart from Torsten Frank's blog uses 100 "Power Percent" as anchor.
The common idea is to anchor models not in the axis, but in specific points on the axis.