Understand Zettelkasten Essentials

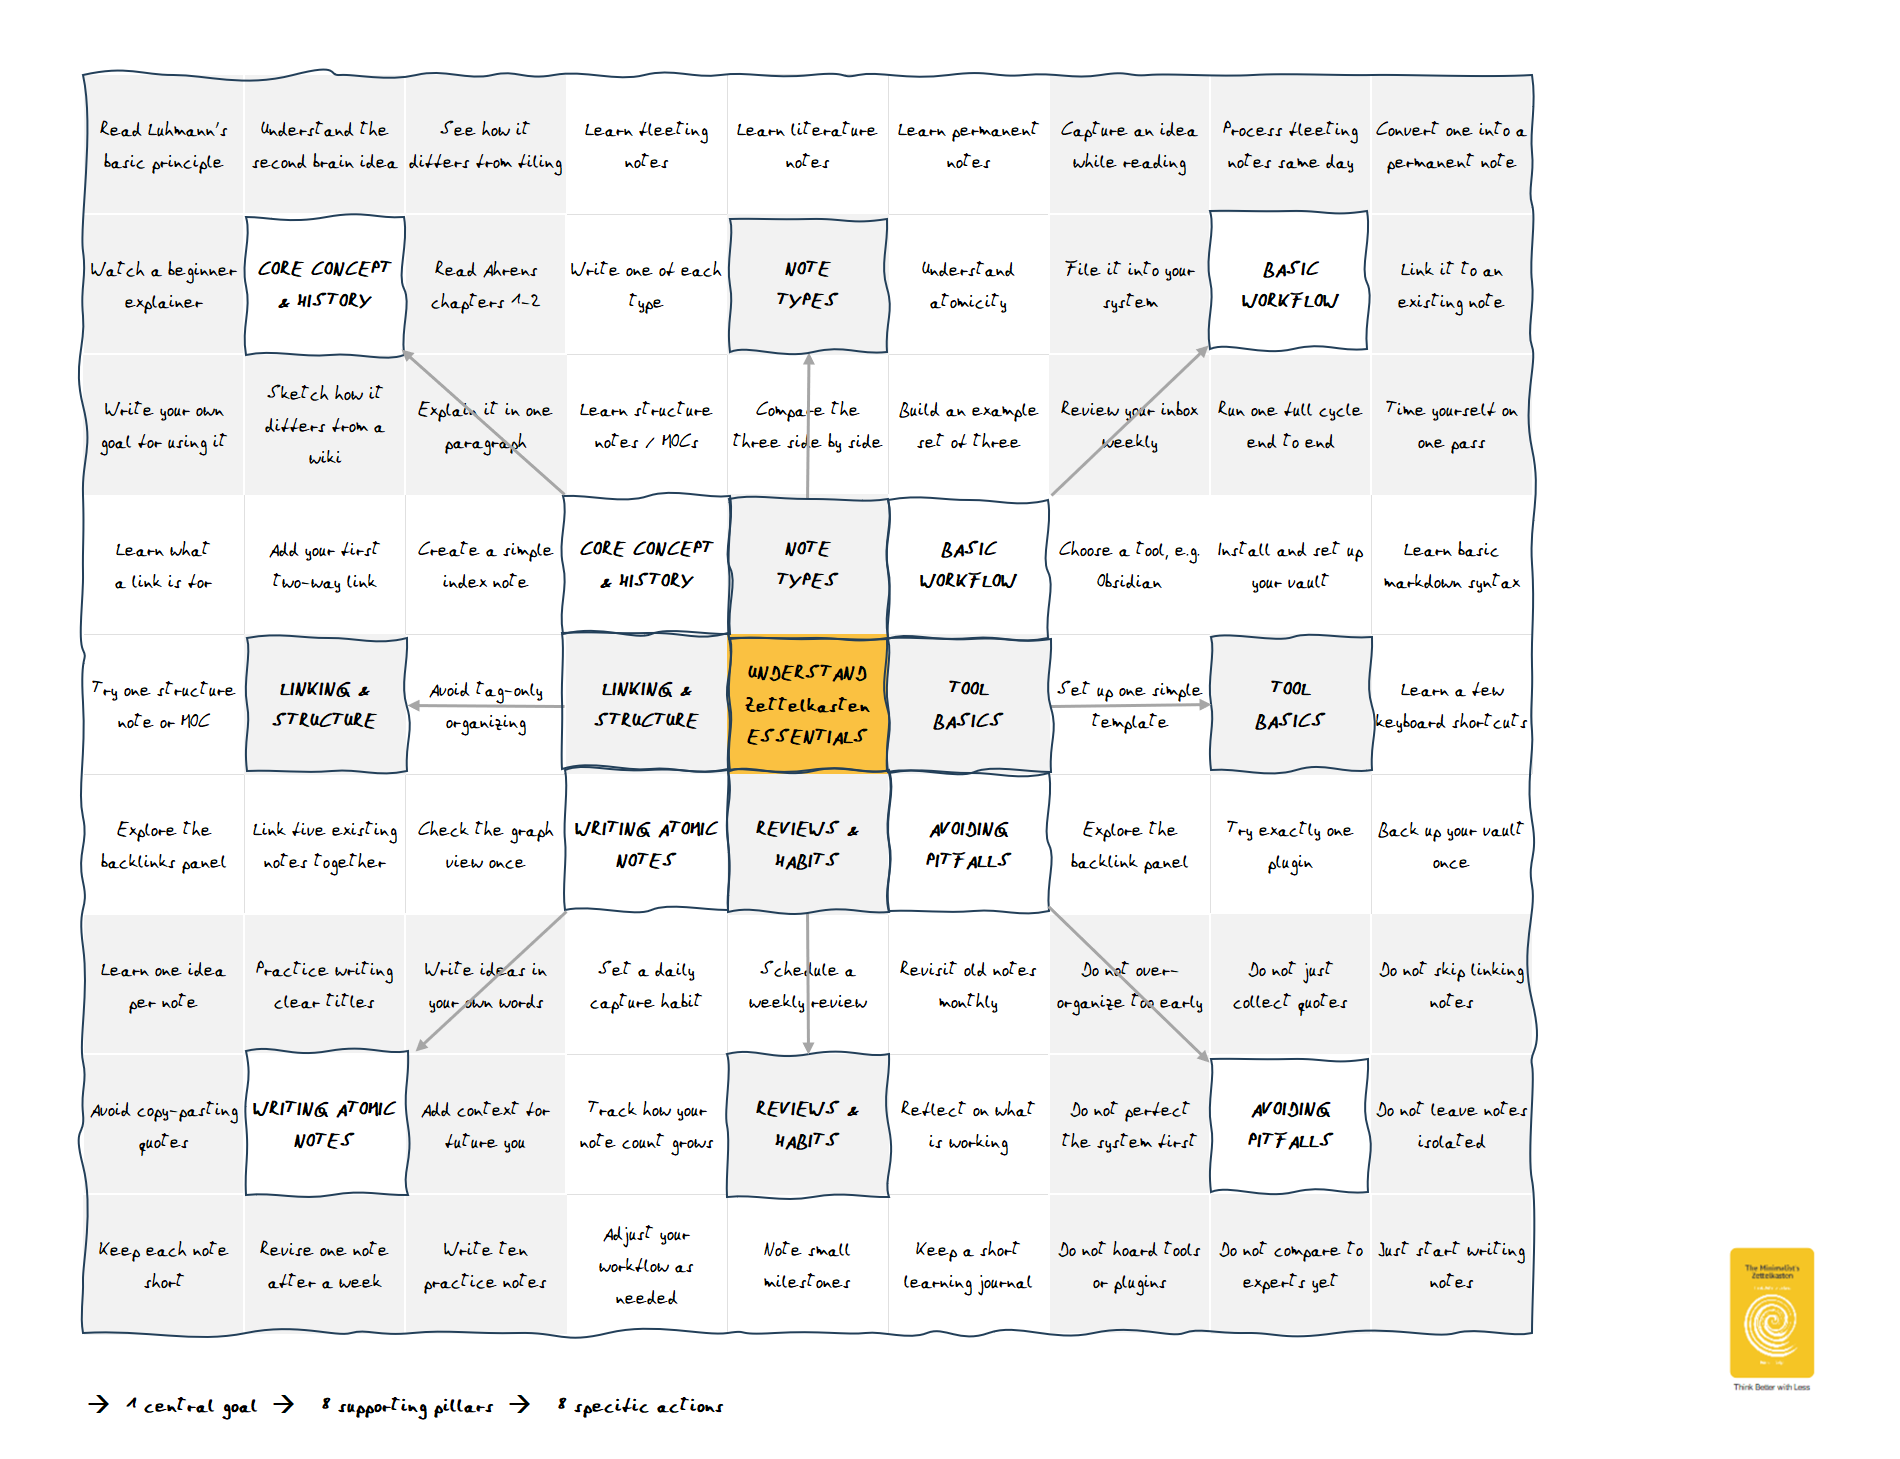
It starts with a clear plan. The Harada Method [1] shows you how to turn your goal into concrete steps. Instead of getting stuck at the initial stage, your goal is systematically broken down into 64 specific actions.
This turns your idea into an actionable plan with daily habits:
- Structure your goal (1 central goal).
- Reduce complexity (8 supporting pillars).
- Define actionable steps (8x8 specific actions).
Reference
[1] Harada, Takashi, and Norman Bodek. The Harada Method the Spirit of Self-Reliance. PCS Press, 2012.
Edmund Gröpl — 100% organic thinking. Less than 5% AI-generated ideas.
Howdy, Stranger!
Categories
- 3K All Categories
- 153 Research & Reading
- 703 The Zettelkasten Method
- 12 Knowledge Work
- 102 Writing
- 474 Software & Gadgets
- 158 Workflows
- 733 The Archive
- 15 Plug-In Showcase
- 88 Resolved Issues
- 225 Projects Logs and Journals
- 86 Project: Zettelkasten.de
- 53 Critique my Zettel
- 179 Random
- 375 Introduce Yourselves!
Comments
@Edmund I like that chart! Haven't seen it before, but clearly it has high potential.
Interesting idea to use Shohei Ohtani's version of Harada's Open Window 64 chart in this way. The chart makes sense to me as a mnemonic device that uses a 9x9 grid for loci.
Personally, I prefer the version in Harada's book. It merges the nine center boxes into one.
Here's how the chart would look as a simple HTML table, that can be directly included in a Markdown file. I think it works well, even without custom styling.
Zettelkasten
ESSENTIALS
Great idea to use HTML. It's also easy to add links to relevant web pages:
UNDERSTAND
ZETTELKASTEN
ESSENTIALS
My first idea was to use MS Excel for Harada's Open Window 64 chart. However, HTML could enhance collaborative work within the forum.
Edmund Gröpl — 100% organic thinking. Less than 5% AI-generated ideas.
Incidentally, aside from YAML properties or however one writes digital Zettln, the HTML form is an example of a structure note, in @Sascha's sense.
Zettel GitHub. Zettel Wiki Erdős #2. Problems worthy of attack prove their worth by hitting back. -- Piet Hein. PROBLEMS. Grooks, 1966. CC BY-SA 4.0.
Exactly.
I am a Zettler
I like HTML in my personal notes for similar reasons. The content is accessible by full-text search. The links are accessible for backlink search and command line tools. Version control is much easier, because it's just text. And the files are smaller.
In Obsidian I enjoy tinkering with CSS. This is how the chart looks like in my zettelkasten. The colors are inspired by the Harada/Bodek book:
PS: Nice workaround with the
<small>tags! It makes the chart much more readible in the forum.@harr, I've been impressed by your custom CSS examples that I've seen in the forum. I would love to see more whenever it's relevant.
The CSS is good. The links are missing.
Zettel GitHub. Zettel Wiki Erdős #2. Problems worthy of attack prove their worth by hitting back. -- Piet Hein. PROBLEMS. Grooks, 1966. CC BY-SA 4.0.
Thanks!
Thanks! The links are formatted as normal text. In my local system are discoverable on mouse-over. I find it easier to read.
I wouldn't do it that way. I would create a mind map instead, and put a link to it into the card. I would also serialize the mind map into an indented list and put that into the card. For each main branch of the mind map/list, I would create a child card. For each one of these cards' branches I cared enough about I would create another child card for it.
I don't see much value in being able to search for individual box labels. If I can remember enough to search, I already know what it says well enough. If not, I can't run a search anyway. Better just to navigate to the parent card and look at the graphic.
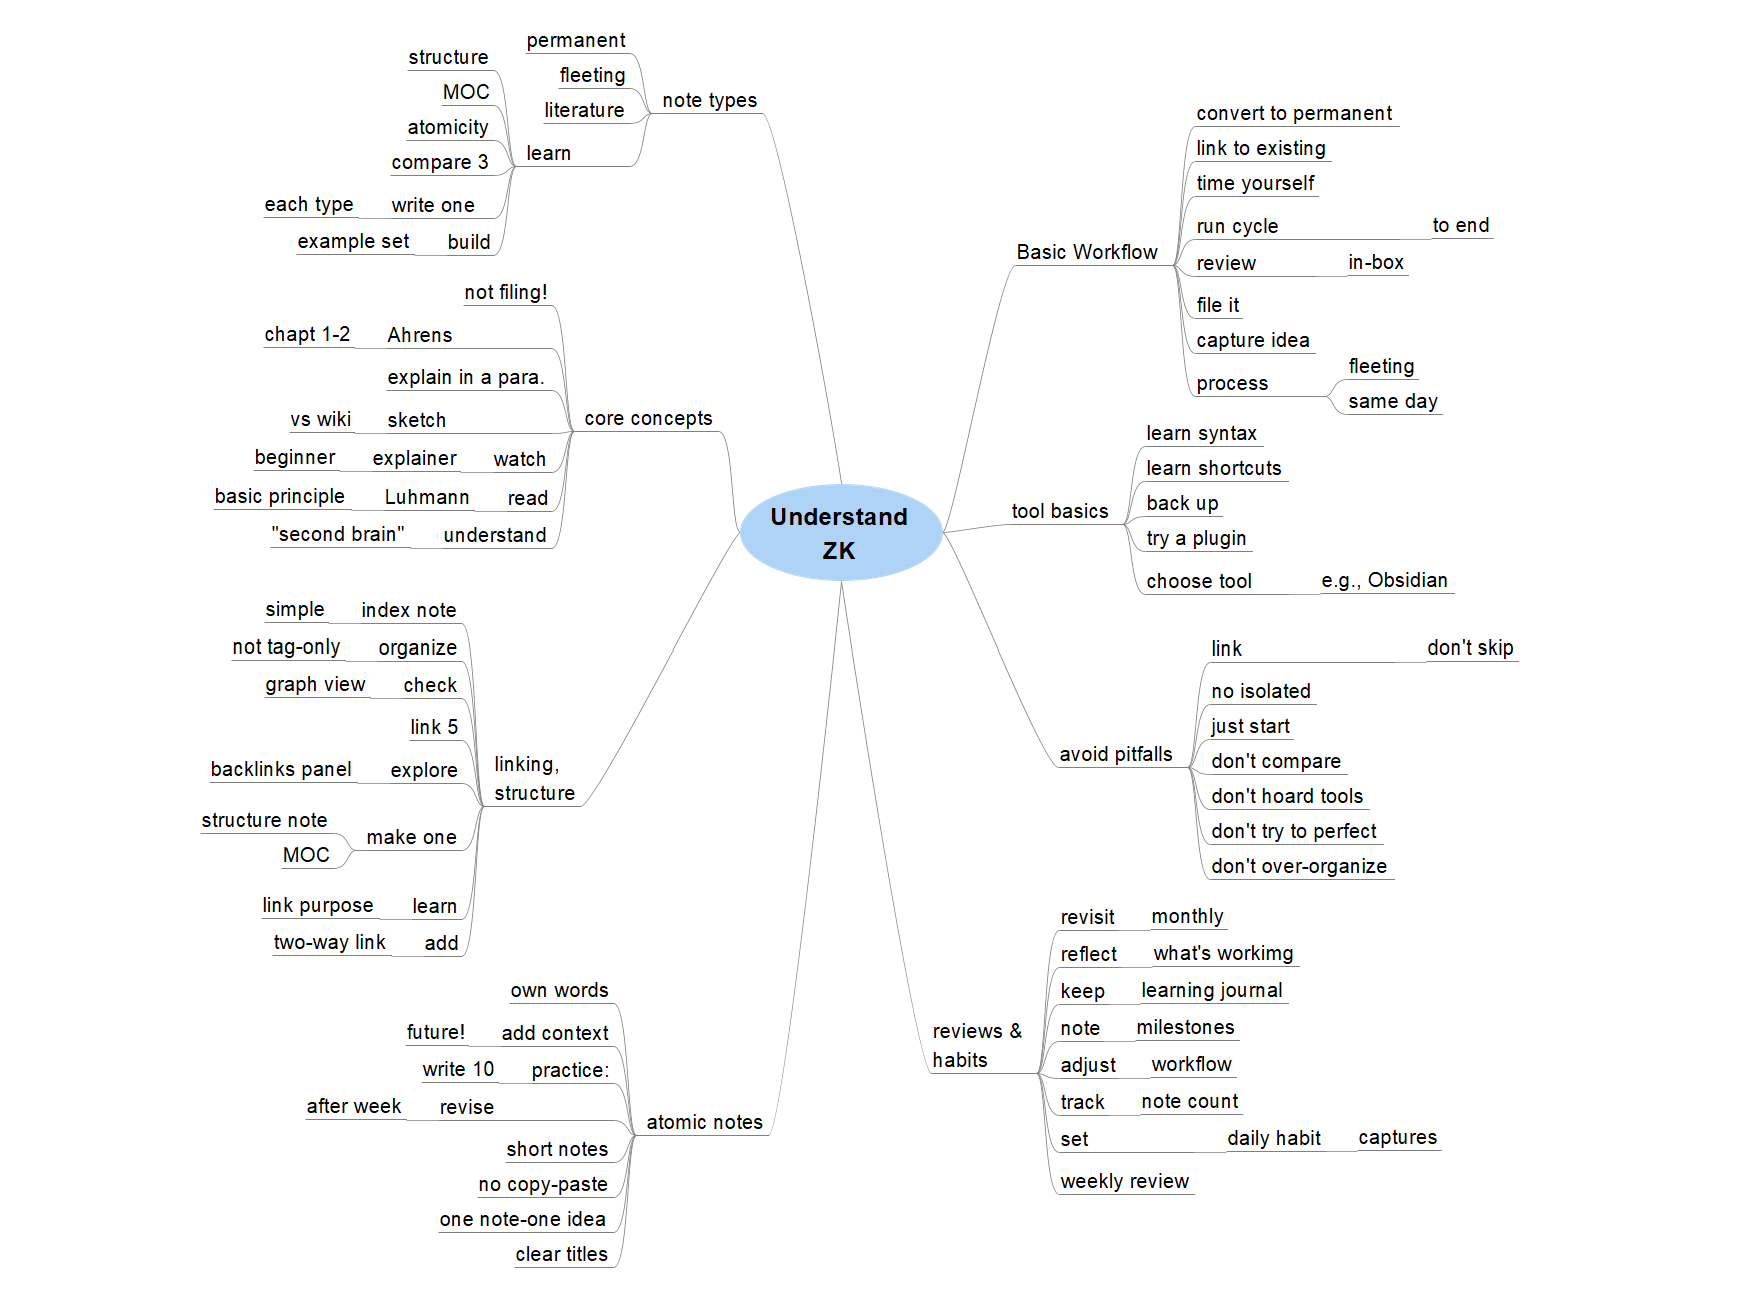
Here is a quick stab at a mind map.
I'm not too clear about the purpose of this chart. Is it advice to newcomers, recommendations for daily practice, preaching about workflow, something else? It doesn't seem to represent an atomic idea.
I read it as a teaching tool. It works for me, because it provides a fixed spatial layout with a simple gestalt. As a teacher I can point at stuff. As a student I can check off progress.
But I also understand the confusion, because other sources describe that chart type as a creativity tool.
BTW, I learned that the chart type in @Edmund's initial post is older than Harada's method.
Apparently it was developed in 1979 by Yasuo Matsumura and marketed under the name "Mandala Chart". It seems that the name is registered (in Japan?). At least that's how I understand the website https://mandalachart.jp with the help of Google Translate. They even have an "official" app.
There are many templates available online for Mandala Charts. Some use other names like "Lotus blossom".
Apparently the famous Japanese baseball player Shohei Ohtani filled out such a Mandala Chart while he was still in high-school. I haven't checked it myself, but the biopic Beyond the Dream supposedly features it.
I don't know if Harada developed a similar chart independently, or if he had been familiar with the Mandala Chart.
The differences are subtle. One unfolds a smaller 3x3 chart into a larger 9x9 chart, the other collects 64 specific actions. Not sure if the difference really matters for practical applications. Maybe this is just a legal thing, where the same idea is sold with a small twist under a different name.
I don't know if this chart is the final answer for making sense of zettelkasten, but I appreciate the idea. It's also an example where artificial constraints (fixed grid vs organic branching) can increase creativity.
Yes, that's the main reason why I chose this chart type.
Otherwise, I would have chosen my preferred concept map ;-)
Edmund Gröpl — 100% organic thinking. Less than 5% AI-generated ideas.
No mouse-over on my end. I see it was a jpeg.
Zettel GitHub. Zettel Wiki Erdős #2. Problems worthy of attack prove their worth by hitting back. -- Piet Hein. PROBLEMS. Grooks, 1966. CC BY-SA 4.0.
I don't see that at all. The grid boxes one in with no room to put anything new. The mind map invites extending and adding to the ideas. Other branching formats should do the same.
You only see a screenshot of my zettelkasten in Obsidian. I'm not trying to make it work here in the forum. I'm sharing it as an example of how a zettelkasten can look like, when your zettelkasten app supports custom CSS.
That's the idea. You have to remove something old, if you want to add something new. You could also rephrase or rearrange the items in the boxes.
Mandala charts and mind maps are different tools for a different purposes.
Why "should" they do the same? Why not try other approaches as well?
A framework with a fixed number of options forces you to prioritize. Why are listicles so popular? I think it's because they help navigate complex topics with a simple structure.
@Edmund titled this thread "Understand Zettelkasten Essentials". This prompts the question:
What are the essentials of zettelkasten?
@Edmund made the effort to select and group 64 items that he considers essential. He presented them in a compact design. He is open for collaboration in the forum. I consider this an excellent starting point for a conversation about Zettelkasten Essentials.
If the goal "Understand Zettelkasten Essentials" is not ambitious enough, let's start with "Become a Zettelkasten expert":
Obsidian Canvas offers a top view with colors only:
Edmund Gröpl — 100% organic thinking. Less than 5% AI-generated ideas.
I find the general idea appealing, as I love symmetry. I see it as being a kind of symmetrical mind map.
The eight action steps for each pillar are both a pro and a con:
I guess this method would make you summarize or synthesize more than eight action points down to eight, so it's not entirely restrictive. The same could be said for the eight pillars.
Overall though, it makes a nice change from mind maps. It's something to try out.
There is not a single box on those charts about what a Zettelkasten is for, why you might want to use one, how it is about thinking, working out ideas, capturing trains of thought, reminding you of important things you know you will want to visit again, searching as a key way to refresh yourself on what's in the box, helping to find unexpected connections; none of the things that the Zettelkasten and its art are about.
That's why I have trouble understanding what the purpose of the chart is. Someone who is thinking about taking up zettling needs to know about the thinking aspects. Someone who is experienced doesn't need to do the introductory exercises, as many of the chart items seem to be.
A beginner will find the full panoply overwhelming. If I had seen a chart like that at the beginning, and was told that it's the essence of zettling, that I needed to absorb it, I just wouldn't have. I'd have turned to something else instead of zettling.
I get that the chart seems to be a compilation of tasks and procedures that some people say have been useful for them. That's fine. There's value in that. But zettling isn't about procedures and tasks, it's about thinking. That's why I can't see charts like this as being about "Essentials" or "Becoming an expert".
If you want to become a composer (of music), you do need to learn how to notate a score. But being a composer is about the music, not the notation.
Hmm. Not sure if this works for me. The appeal of the initial chart was to have only one chart. The hard limit encouraged prioritization. There was a sense that all boxes mattered and needed to be completed. The visualization added value.
If the goal is an open collection and categorization of a broad range of exercises, skills and heuristics, I'd go with a mind map. For example in Mindnode:
I also like to use simple nested lists in Markdown as a starting point. Tags can help track status. For example:
Craft & taxonomy
#nextstepsTheory and frameworks
#nextstepsTooling mastery
#nextstepsReading & input cycle
Writing output
Review & maintenance
Community & teaching
Mind & habits
#nextstepsI enjoy visualizations. But in this case, I don't see the benefit of using a Mandala chart.
BTW, the "Harada method" is about more than just a chart. For example, it also adds a time constraint. Chapter 10 of the Harada/Bodek book:
And it's about tasks. Also chapter 10:
I like the parts of the initial chart that contain tasks.
Let me show you another view: I use my Zettelkasten for long-term thinking. My notes are about ideas, observations, propositions, questions, insights, views, arguments, wishes, goals, actions, tasks, and many more. They build my web of thought.
I’m used to living with clear goals. To this end, I’ve set up an OKR system in my card index. By adding the Harada diagrams, I can now visualise my goals and actions on one single page.
Edmund Gröpl — 100% organic thinking. Less than 5% AI-generated ideas.
So that's the answer to my wondering about the purpose of the chart. It's a way to have a z-card about a set of tasks and coordinated tasks. That's cool. I'm all for using any and all graphics that help; it's one of my own principles. My reaction was to the idea that seemed to be the point of the post, that beginners (and maybe beyond beginners) needed to execute all the chart items to understand zettling.
I interpreted the idea similarly, but with a positive response. :-)
I like the general idea of an overview that covers the essentials. And I find the Mandala chart surprisingly promising for that purpose.
I also like that the initial chart prompts the question, what we consider "essential" for learning and teaching "Zettelkasten".
OKR, PKI, heat maps and dashboards are fascinating rabbit holes . :-) I consider them Zettelkasten-adjacent, ie they can be included in a digital Zettelkasten, but aren't essential for a Zettelkasten.
I, on the other hand, think that any ways that help bring the conceptual context back to mind or refresh its details are valuable and not just a sideline. Text can't represent everything. To me, the point is helping one to grasp a thought trail (to use Vannabar Bush's phrase) and trails are much more complex that just word sequences.
How do OKR, PKI, heat maps and dashboards bring conceptual context back to mind? I consider them as performance-oriented tools that help you choose the next task.
Agreed. But is it essential for a zettelkasten to have visualizations? I don't think so, because some of the best known zettelkastens don't have any. :-)
Can visualizations be valuable? Definitely.
I'm curious what source you have in mind. Bush's famous article As We May Think (1945)12 doesn't use the phrase "thought trail". Bush's Memex doesn't link thoughts, it links resources that are being automatically displayed on a device.
In today's language, I'd describe a Memex trail as a sequence of links. In a digital zettelkasten you could implement a trail very simply with a structure note. More generally, any list of links in a hypertext system that guides a user through pre-selected sources could be considered a trail. I'd also think of a PowerPoint presentation that embeds and comments various online sources as a trail. You could even consider this comment here as a trail, because it contains links to online resources that you can view on your device with a simple click/tap.
Is it possible, that you mean train of thought in the Hobbesian sense, a "succession of one thought to another"3?
https://www.theatlantic.com/magazine/archive/1945/07/as-we-may-think/303881/ (Paywalled) ↩︎
https://web.archive.org/web/20240726075337/https://cdn.theatlantic.com/media/archives/1945/07/176-1/132407932.pdf (PDF) ↩︎
https://en.wikipedia.org/wiki/Train_of_thought ↩︎
As We May Think
And
and
So yes, "trail of thought" works perfectly for me.
It can be more than a straight sequence of links. It can include side branches, resources such as images of reports, what have you.
Trains or trails, I don't care, though I think "trails" is more apt here.
Not for me. :-) The machine joins artefacts, not thoughts.
For me the trail metaphor conjures up sequentially. In Bush's words:
The point I was trying to make here is that the Memex trail is not about connecting thoughts, but about accessing resources. Bush:
With current digital hypertext technology, we wouldn't take photos on film, but most likely locate resources with Uniform Resource Locators (URL)—typically presented as links or embeds.
Good to know.
If you get right down to it, everything in a ZK is an artifact, not a thought. They only connect or access resources. The same for books.
The point, for me at least, is to have artifacts that remind, stimulate, promote, or create thinking.
That strikes me as a concept that could change the world as it's shortly to be, if only we could get the LLM faithful to get that message!
More seriously, the connections between ideas seem very important, rivaling ideas themselves. Cognition and connections must be closely related.
Wow! That's actually a great design about what a good ZK scheme should be!
And I find so interesting the way it simplifies the essentials of ZK. I haven't seen this chart before, but now I can understand a little bir more about it.
Great!