Graph view with older Zettelkastens?

I am again finding myself experimenting with a graphical view after watching Bob Dotos Video on how to use Obsidian to write an essay. He seems to have a quite young Zettelkasten or at least does not make use of connection like I use. With a depth=2 a local graph by my Zettelkasten looks like this:
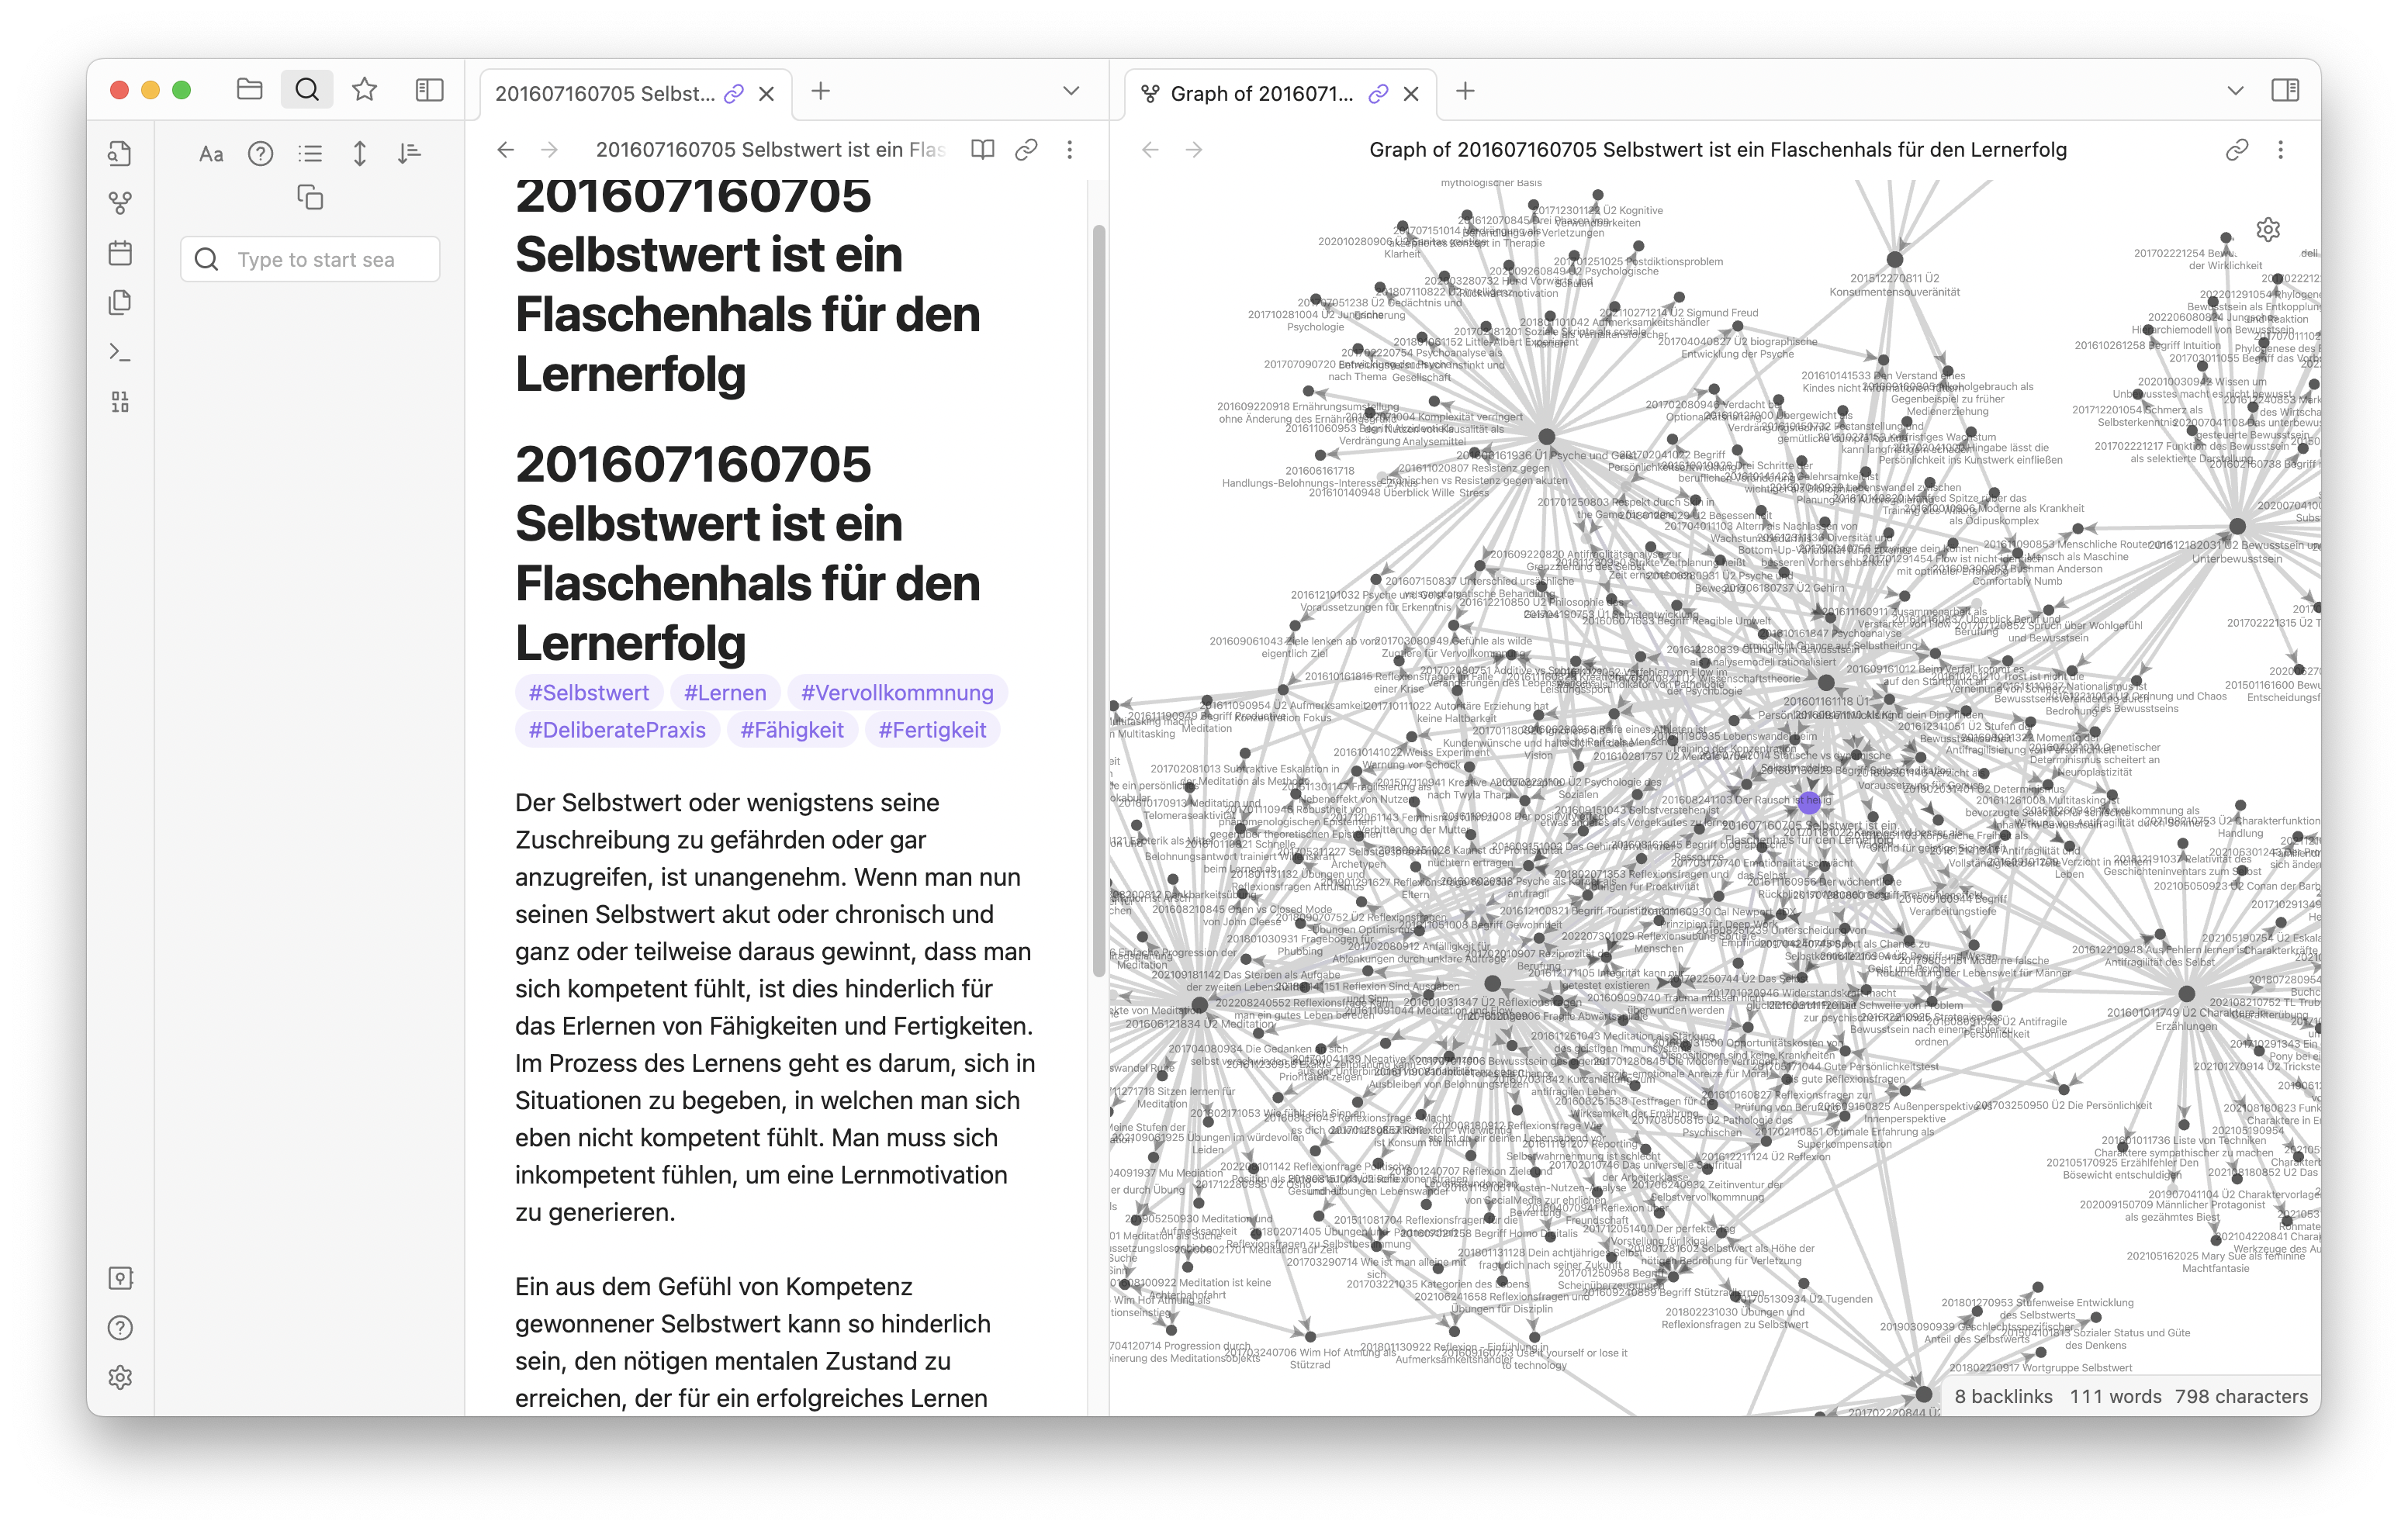
This is pretty typical when I browse my Zettelkasten and I am not able to get value from it. Of course, I am not practiced in using a graph view and my practice is by no means informed by a graph view. So, that could be confounders.
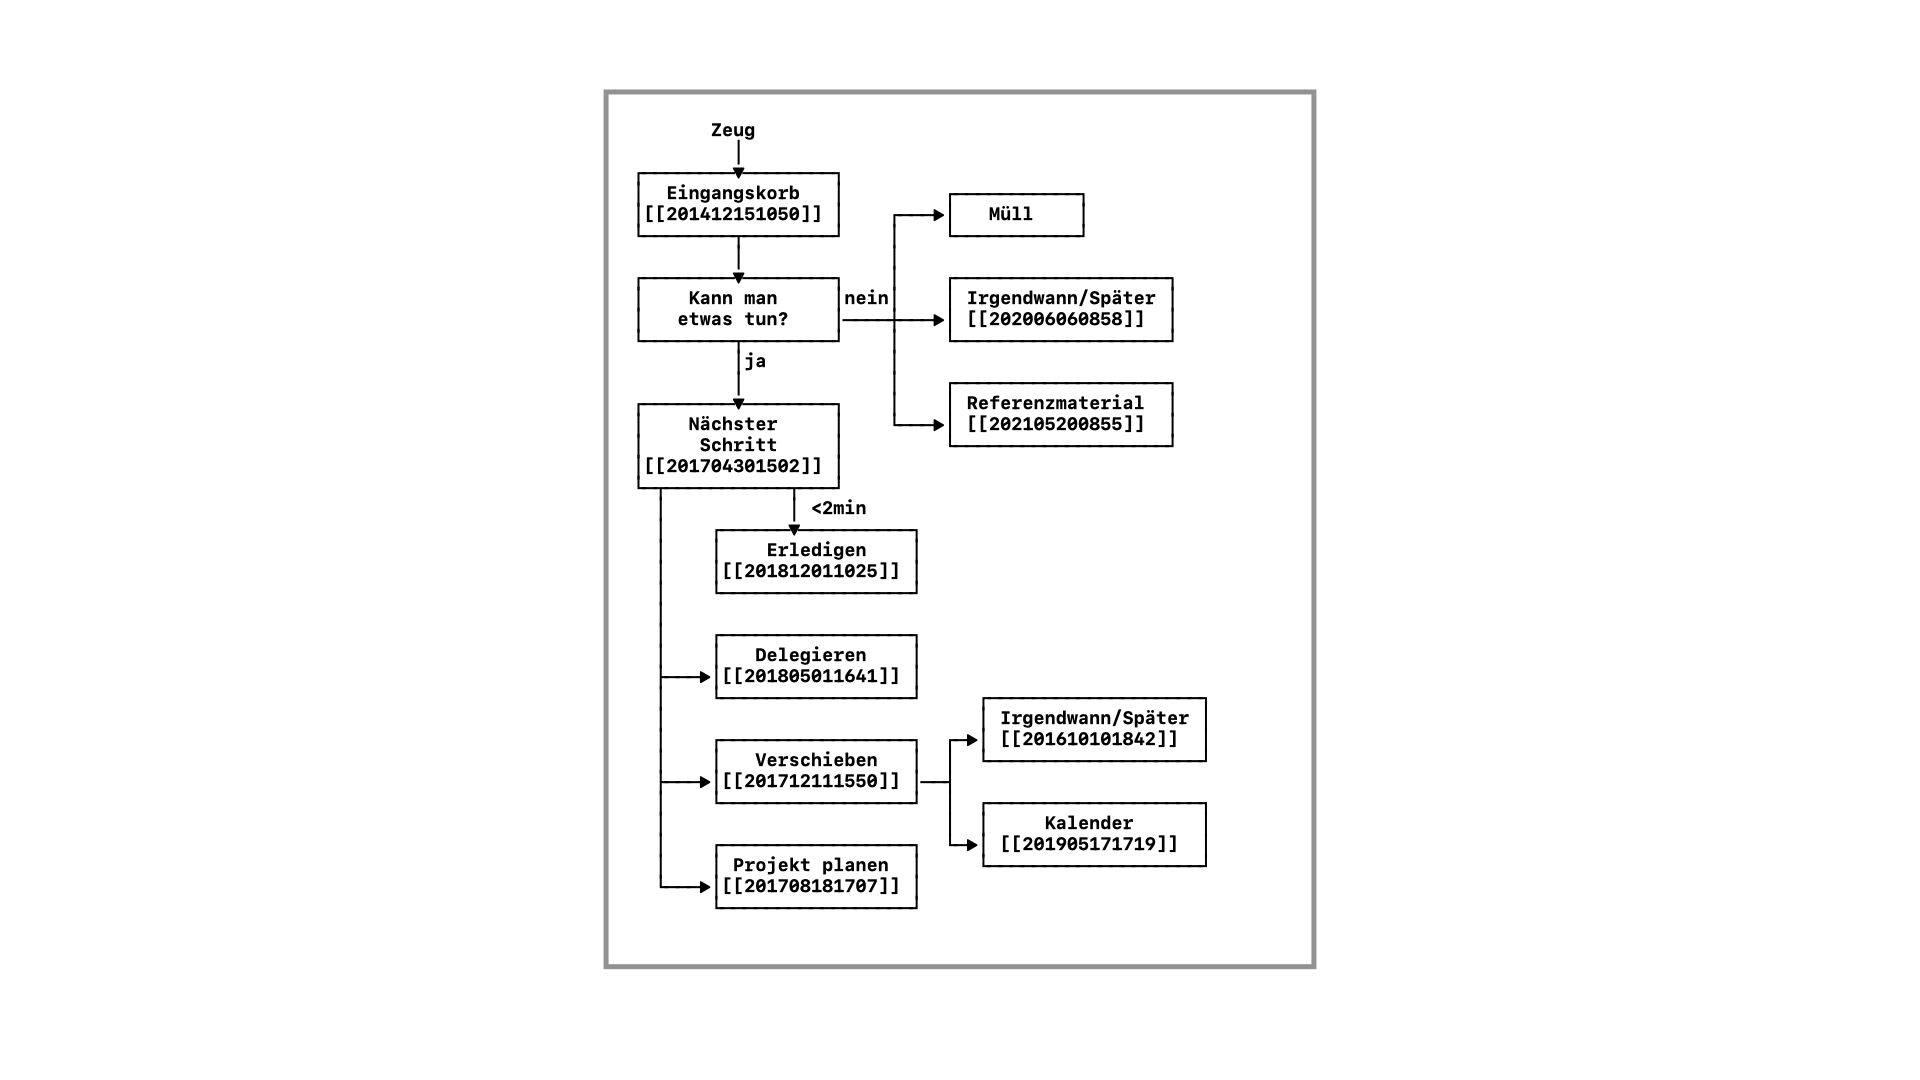
So, I find myself at a strange tension point: I really like using visual structures for my own Zettelkasten work. This is an example (actually from the book):
But whenever I run into the graph view I find myself unable to make it work.
I am not willing to stop challenging my position on graph view yet. I have a gut feeling that there is a blind spot I am not aware of. But I am confronted with a similar issue like many people it seems: There are no genuine demonstrations out there but just mock examples. Bob's video is a very concise demonstration on how writing with a Zettelkasten can be realised. I recommend to watch it to enrich your perspective. But the youth of his Zettelkasten makes the graph view part not applicable to my own Zettelkasten.
I filter methods and techniques by their longevity. And if the graph view cannot show its power with older and more developed Zettelkastens I don't think it is very promising to get into it. I want to concentrate my time and effort on methods and techniques that scale.
So, my question is: Are you aware of examples of graph view being used for more older and complex Zettelkastens?
Additional thought: Perhaps, the graph view is suited most to develop underdeveloped parts of the Zettelkasten?
I am a Zettler
Howdy, Stranger!
Comments
Some background:
I've tried to build something myself based on vis-network to visualise the notes. I ran into a few usability problems:
In the end, I did add a small graph view to each note, but it only shows the direct links to other notes. Even then, for heavily interconnected notes like structure notes, it's already too visually cluttered. For simpler notes it's ok, but it doesn't really add anything besides something visual to look at. All the information I have in the graph is also available as part of the note itself. The graph I ended up with looks like the (example) screenshot below:
For a follow-up attempt I would like to try a mindmap-like layout, radiating out from a central, selectable, note. Or maybe something dynamic that allows you to build a "path" of notes ...
To answer your questions:
See above for my personal use case.
For me, not really. I use a simpler metric for this. Any note that has no incoming links is marked visually in my Zettelkasten, so I know which notes need some love when adding new notes. This also applies to orphaned notes (no incoming or outgoing links). Additionally, I sort lists of notes based on the number of incoming links a note has, so the more a note is referenced, the more important a note is to me.
@sfast, this is the core of what I wrote about in my topography post — in your ZK, where you make use of the “multiple layers” of ZK via structure notes, you will almost definitely not derive value over time from the graph view (without additional work). The topographical perspective says here that you are getting a “bird’s-eye” view of your ZK in the graph — that you are looking down, from the sky, at the “peaks” of information (that is, the second and third layers of evidence), and are simultaneously exposed to all of the “smaller” pieces of evidence that are used to build up to that point.
In Bob’s ZK, since he uses a modified Folgezettel as the primary organizational method, he is getting a richer, contextual view of his notes — just like walking down the street and noticing a café that looks interesting to you.
In short, I don’t think it’s an “age” thing — though that does come into play to some degree — it’s an effect of the different organizational practices you take.
Thanks for the walk-through of your graphing. Our experiences coincide. I wonder how you order your note list based on the number of incoming links. Why have you settled on incoming links as the indicator for note ranking? What about considering outbound links, the number of tags, or the number of links to structure notes?
Will Simpson
My peak cognition is behind me. One day soon, I will read my last book, write my last note, eat my last meal, and kiss my sweetie for the last time.
My Internet Home — My Now Page
Many thanks for sharing your findings Sascha., I appreciate your insights.
Perhaps I'm in the minority on this issue but... While endlessly fascinating to me as well, I've yet to find any practical use for such a graphical view other than well, just looking at it. Has anyone derived a use for it? Speaking only for myself, a tag cloud seems more actionable.
Tinybase: plain text database for BSD, Linux, Windows (& hopefully Mac soon)
Mainly pragmatism :-). I figure that if I reference a note a lot in other notes, the information in the note being referenced is "more valuable", since I keep coming back to it. I don't do tagging, and structure notes are a later addition to my Zettelkasten, and are treated as regular notes, but with a lot of outgoing links. So those two are out too. Do either of those help you in using your Zettelkasten? I'm always looking to improve this metric.
I also use the incoming links metric to programmatically ask my Zettelkasten how to find the least number of related notes between two separate ideas, but that's getting off topic.
Well, if such a visual depiction allowed you to (say) grab the label of a given node using your mouse pointer & then 'graft' it onto another node along with rewiring its umm... 'route'. That would be quite nifty.
Tinybase: plain text database for BSD, Linux, Windows (& hopefully Mac soon)
The default graph view in Obsidian (which Sascha used above) is suboptimal in my view. Optimal graph view software are still in development. There are several plug-ins for Obsidian that provide alternative network styles and layouts, and these plug-ins are still being developed: Breadcrumbs, Excalibrain, Juggl. There is a lot of opportunity for software developers in this space.
@Sascha I believe your point is right on the money. My experience has been the same - that graph views may be useful for under-developed ZKs, but as your Zettelkasten becomes more mature and just plain older, the connections and network become much more complex and dense. I don’t think a graph view will help much with that kind of Zettelkasten.
Ah, nice. This could be some assistance to what Luhmann called cluster formation in his article.
Ah, a good reminder to actually write my own take on your topography model. I will write down some thoughts in no particular order because my more systematic take is still in the making (actually on my ToDo-list since I just processed your article).
While I think there is indeed a bird's eye view as well as a streets view I don't see Folgezettel to provide the streets view: Being in the streets means that you actually see what is going on in the streets. In the Zettelkasten, this means that you see the content of the notes, the nature of the connections. Not just nods and edges.
Both Structure Notes and Folgezettel provide a bird's eye view if you use just the hierarchical form of Structure Notes.
Folgezettel does not provide a street's view since you are not on the street. You see a label (a number and the title) and highly reduced relations to other notes (being parents/children/siblings). Because of the high discrepancy of the possible relations between notes and the number of possible options to map those relations (three -- or four if you count a cross-reference as an additional relation) Folgezettel is not only a map but it is a very unrich map.
The café is a note content.
I am not quite sure if in Bob's case Fz impacts the graph view because I not sure if he replicates the connections established by Fz in the note in the form of links. If not, this could further improve his ability to use the Graph View since it eliminates more links.
I love your premises and model but I arrive at opposite conclusions.")
Thanks for the tipps, @Andy. I will juggle with juggl and see where it leads me.
EDIT: Sadly. I cannot use it.
I am a Zettler
My thoughts come with the caveats that I don't have nearly as old or expansive a system as most of you, and also my notes approach doesn't follow Luhmann very closely. I do have several note clusters that approach a level of interconnectivity that makes the graph visualization difficult to parse, though. In those cases, there are two things that make the local graph potentially useful.
First, I have filter groups set up that color code the nodes. This makes it easy to see by eye what types of notes are in the local area. My notes include several "types" of note, so my colors are built around that. I have different colors for my zettel, for reference notes, for daily notes, for people, for topic (structure) notes, etc. If a node is uncolored, then I know that I haven't spent much time working with it because it isn't tagged, so that provides an opportunity to flesh out my notes.
If you are following a more Luhmann approach to ZK, then the tags you pick for filter groups might be trickier. Lowest level would probably just be a color for zettel, and then a different color for structure note levels. Maybe a color for unfinished zettel, and one for good a good "entry point" into a topic. Then, when you are looking at your local view you'll be able to see not only what nearby notes need more work, but also how deep into your note chains you are. More structure notes means you are closer to the surface on various topics. You might even be surprised to see a structure note you didn't expect is nearby.
Maybe a more challenging way of doing the color filters would be a more topic oriented color filtering. This is really going to depend on what topics you take notes on. For my chemistry oriented ZK, I might do a color for computational work, a color for fundamentals/theory. I could maybe do filters based on how solid a claim is (i.e., is this a single experiment observation, or is this result well understood in the community). I think this approach works best if you write on a few topics rather than a lot of different topics. I wish that Obsidian would let you save filter groups and swap between them. Then you could swap your coloring mode based on what you are trying to do. Maybe this should be a feature request or a plug in.
My second tip for complicated note nodes, though, is to not treat it like a static display. You can easily change between the display note depths. Decrease it to 1 and see what notes remain and how they are interconnected. Bump it up to 2, and then hover over a node so that the graph view highlights that note's direct connections. Hover over a node and press the command button so you can see a preview of a note. Turn off "Neighbor Links" and you get a cleaner view of the note trails that lead directly to or away from your current note. You can turn off "Outgoing Links" to see only the links that point towards your current note, or turn off "Incoming Links" to only see the paths away from your notes.
Swapping between looking at incoming and outgoing links will often surprise me, as there might be way more of one type of link than the other type for a given note. It can also change the type of notes that I'm looking at. Incoming links are more likely to contain daily notes. If I have a cluster of daily notes around a note, it means that note is frequently important to whatever I'm working on. I keep returning to it in a way that felt meaningful enough to write down in my daily note. Incoming notes shows the "discoverability" of the note that I'm on. It shows the paths I could take to reach this note. If it is sparse, then I'm unlikely to find this note. If it is crowded with daily notes, then I'm unlikely to find it since I don't review daily notes as frequently. If it's mostly made up of references, then I know I have a well established thought in the literature. Outgoing links shows a more topic oriented view of my graph, as it rarely contains daily notes. This is probably the more useful view when I'm working in my notes, unless I'm interested in checking the discoverability of a given note. This can be especially useful to look at as I make a new note. Every link I make adds more nodes onto the local graph view. Sometimes I add a link and suddenly the view is crowded with a giant cluster, and then I know I've connected my new note into a bigger chain of thought.
I'm not sure what specific value all of this brings. Often, the biggest benefit that I gain from the local graph view is that it reminds me of notes that I haven't visited in a while, or wanted to revisit and flesh out. In trying to parse the topographic structure of the local graph, I'm reminded of notes and links en masse. It isn't always helpful, but it is often enough that I do frequently browse through the local graph for a note. I might take a minute or two to swap between the visualization options (incoming vs ougoing, etc.) and hover over a few nodes or clusters to see what they contain. If nothing pops out at me, then I move on, but occasionally I find something interesting or surprising, or even just am reminded that I keep meaning to fix that one note and flesh out this other note.
ORCID: 0000-0003-2213-2533
IMO, the full graph (esp. for a large note corpus) should focus on the overview (bird's eye) aspect. I.e., the full graph should probably not display individual notes but instead some other properties that work to group individual notes. This could be publications, authors, keywords, link types, no. of incoming/outgoing connections or whatever else makes sense for your own note library.
Opposed to that, the visualisation of individual notes and their connections is IMO most useful after having filtered one's note library down to a relatively small subset, say, something between 10 to 40 notes. Then, the graph truly helps me to show how notes within this subset of notes relate to each other, and which of these notes are likely most important.
And similar to @prometheanhindsight, coloured nodes help to further structure this local graph, as well as link/edge labels and grouping by publication.
For my own app, I've tried to implement various filtering options (such as for tags meant to help with "focussed" navigation of subsets. Especially, there is a "Note" filter column which can be used to only show incoming & outgoing items for some note (in the UI & graph). This is demonstrated (among other things) in this screencast (with some explanations here).
This sounds like a useful technical consideration for me. The underlying model of the graph can figure out "clusters" and show them as such: as aggregates, instead of the data itself. There's algorithms to do that for data analysis. Not that I know any of these")
Author at Zettelkasten.de • https://christiantietze.de/
Here is my graph view from the high level, which of course isn't particularly useful, as it is just a giant hairball. If you compare it to the brain equivalent of a neuron, then it pales in comparison, as a single neuron can have up to 15,000 connections. If you think about it using that analogy, then what is most important is knowing the retrieval cue that serves as the entry point to the neural circuit and what are the most common routes (e.g. which have been strengthened the most because they are most useful). When thinking about a graph view, that is what I would find most valuable. I want to know the most common surfed routes in my zettelkasten.
Here is the graph view, filtered for both notes with #Knowledge-Work and #Sociology. Looking at the graph it kind of looks like there might be a lot of interesting connections I've made between the two topics. But when I play with the graph view forces, it becomes apparent that actually there are only really two connections I've made between the two (idea of structure and idea of abstraction)
Conclusion: I think graph view is cool feature but I don't ever really use it. I think where graph view is useful is when you are exploring brand new data/information sets that are very large and you can do a textual analysis of them. But using it in my own vault is of limited use because I tend to already know my vault well.
I am using the graph view for an additional use case.
With a filtered local graph it’s easy to reduce the complexity of the network chart. As already said above we have eight options to filter the graph to focus on a relevant section of our network of ideas:
Here is my 5 steps process to improve my network of ideas:
1. Filter the network with a local graph of your note of interest.
2. Take a screenshot to fix the filtered result.
3. Use your preferred drawing app to do some note-taking on the screenshot.
4. Update your network in Obsidian by deleting or adding Links.
5. Find new ideas to add in your network like working with a mindmap.
What do you think about this option?
Edmund Gröpl — 100% organic thinking. Less than 5% AI-generated ideas.
@msteffens Yeah, the way how you describe it is the way forward to make the graph view work, I feel.
This exactly my feeling: The GraphView somehow is connected to treating your own material as if it is something unknown and ununderstood to yourself. While it sounds like something good on paper I didn't saw anything productive coming out of it. With productive I don't mean that something is done with the GraphView but a genuine demonstration of either an deep insight (not just mere association stated) or the demonstration of its use in text production (which should be somewhat innovative and promising: If I am more efficient and/or effective and/or more creative with ordinary means I wouldn't care so much about the technique).
At least, this is something new.") Some thoughts:
Some thoughts:
I am a Zettler
This is an important topic. It fits into the "Map vs. Territory" schema. Looking at how closely views reflect reality, how those views are determined, and the relative value of particular views determines the value of the map/graph. Thanks, Sascha.
The zettel I created from topics in this thread.
Will Simpson
My peak cognition is behind me. One day soon, I will read my last book, write my last note, eat my last meal, and kiss my sweetie for the last time.
My Internet Home — My Now Page
Re: Map vs. Territory schema...
Very interesting insights Will. Continuing down this trail, see also Alfred Korzybski's 'The Map Is Not The Territory' & another link here.
The mind boggles...
Tinybase: plain text database for BSD, Linux, Windows (& hopefully Mac soon)