@Loni Thanks for sharing the information on Eagle. I believe you can post links to commercial software here - many have done it. I guess it should have relevance to the ZK world and you should describe why you are posting, and then do it in a way that shares information rather than promotes a product. I believe your post above is a good example.
But to be honest, I don't know if there is a hard and fast rule on this in the forum.
A mood board is a collection of images, words, sketches etc. that enables you to envision the visual language of the project. I know, it is much faster and less limiting (aka image sizes) to collect images digitally. However, there is some kind of magic in printed images that you can lay out in front of you, that you can rearrange, overlap with each other etc. in an instant without thinking about the limitations of the program you are using. Your tools – besides your brain – are 'simply' your eyes, hands and the cards these images/photographs/sketches are printed on. This possibility to physically engage with my knowledge system is what intrigues me the most and works well with my written notes, as well.
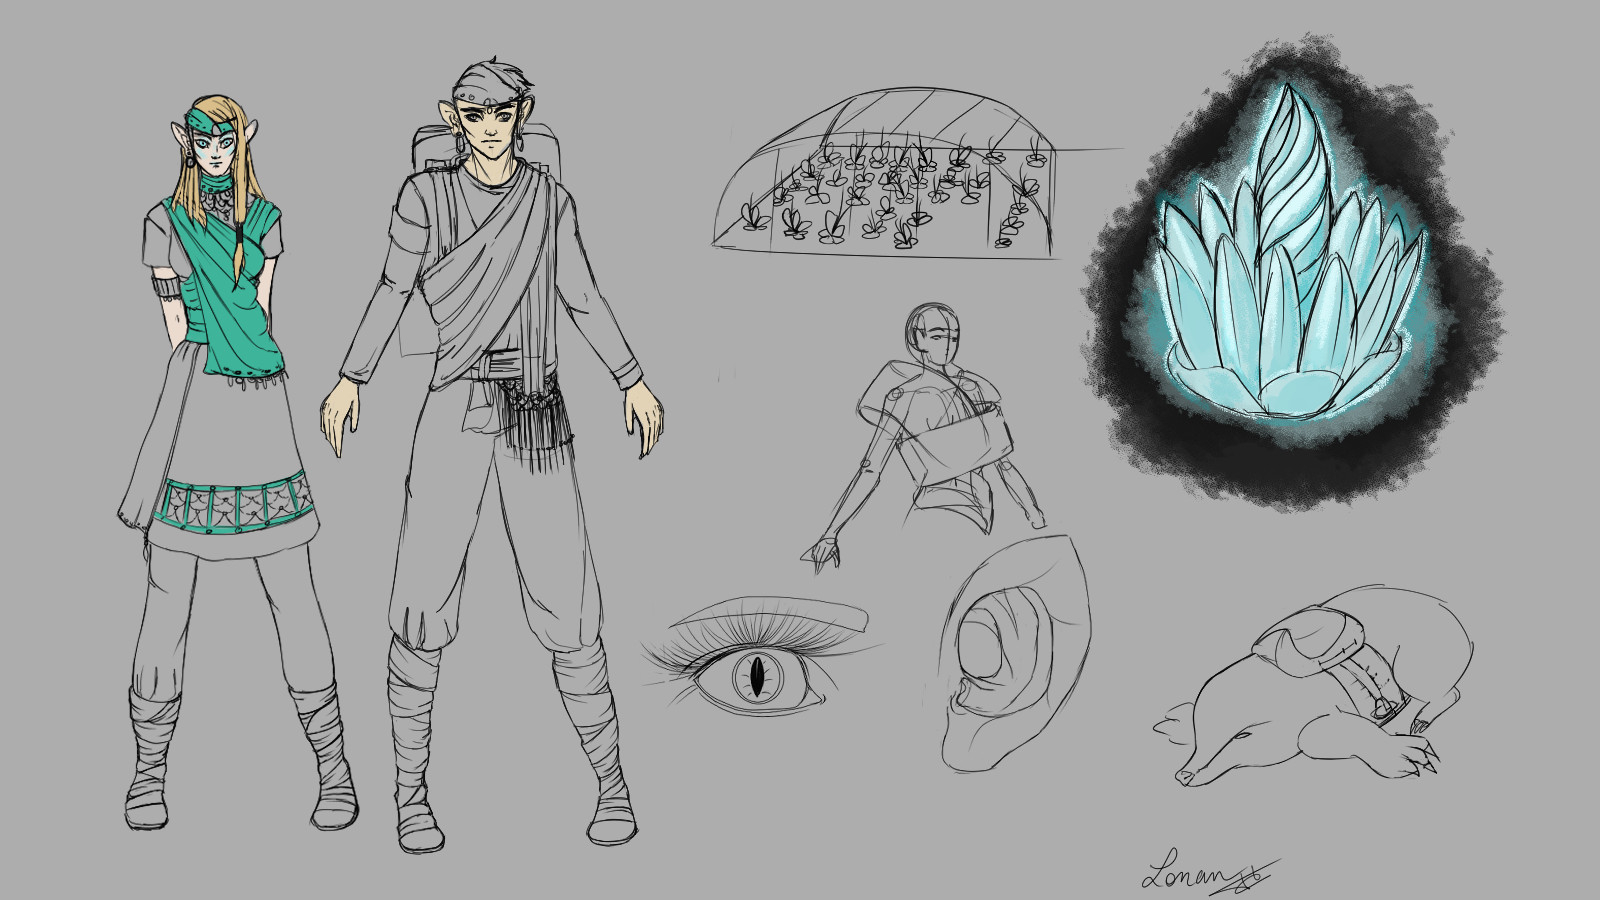
A moodboard is an awesome tool and very, very fun on to make. You can not only add pictures, sketches and all, but also part of the real world. I used them when I design. Now, I take photo and keep the samples on a box and then add them into Eagle to make a design drawing.
(Mine looks like this one:)
The problem with printing is… money. You'll need a printer machine, inks, and all. It can be expansive in the long run. It might not be a problem for everyone, but for someone who works on a specific visual fields, it can become a huge obstacle.
The other problem with analog is anything that are not "real world" objects, pictures and text can't integrate it so easy. As the question is turned for visual thinking, it is not a problem, but sometimes it can emerge. I work a lot with music files to find inspiration, a 3D artist might have a need for other 3D references. But this problem is the same for a digital Zettelkasten as well, as a lot of softwares don't read a lot of formats neither.
So analogic Zettelkasten might not be the perfect solution for anyone, but it is a very tempting one. Don't look after me, I'll be back after sniffing paper, cheers !
@GeoEng51 said:
But...if you want to really speed up your typing, you will learn to use alternate keyboards where the key layout is designed for speed. Two such keyboards are Dvorak and Colemak. I actually have Colemak installed on my computer but find the learning hump to be too large to make the switch.
You are totaly right ! I have read about this new mappings solutions. In french, we need a lot of typos which are unpratical to make however. A usable mapping for me would be "BÉPO" but I would have to learn from start and right now, I am on a production tempo for my novels and I need to be quick. I will (try to) learn this mapping after publishing the first one to see one deadline behind me.
@Loni Thanks for sharing the information on Eagle. I believe you can post links to commercial software here - many have done it. I guess it should have relevance to the ZK world and you should describe why you are posting, and then do it in a way that shares information rather than promotes a product. I believe your post above is a good example.
I looked up the device and found these videos on the topic by YouTuber "pixel leaves":
The thing about Sacha Chua is that she's tinkering with the output of her SuperNote to generate textual representations of the notes as well. That might help with visual note taking and plain text Zettelkasten. She also applies custom color keys to the 4 grayscale output
The device has data import downsides, but Sacha got it working, so maybe giving this another year, it might be a useful combo with plain text notes.
Watching the video that @IvanFerrero posted at the start of this thread and reading everyone's comments had me revisit the analysis of interviews I conducted with diversity officers in Japan. Reflecting at how I conducted the analysis makes me think that creating a visual orientated Zettelkasten is more in line with how I work. Let me share a little of my analysis through the process to the final publication of the results.
The Process
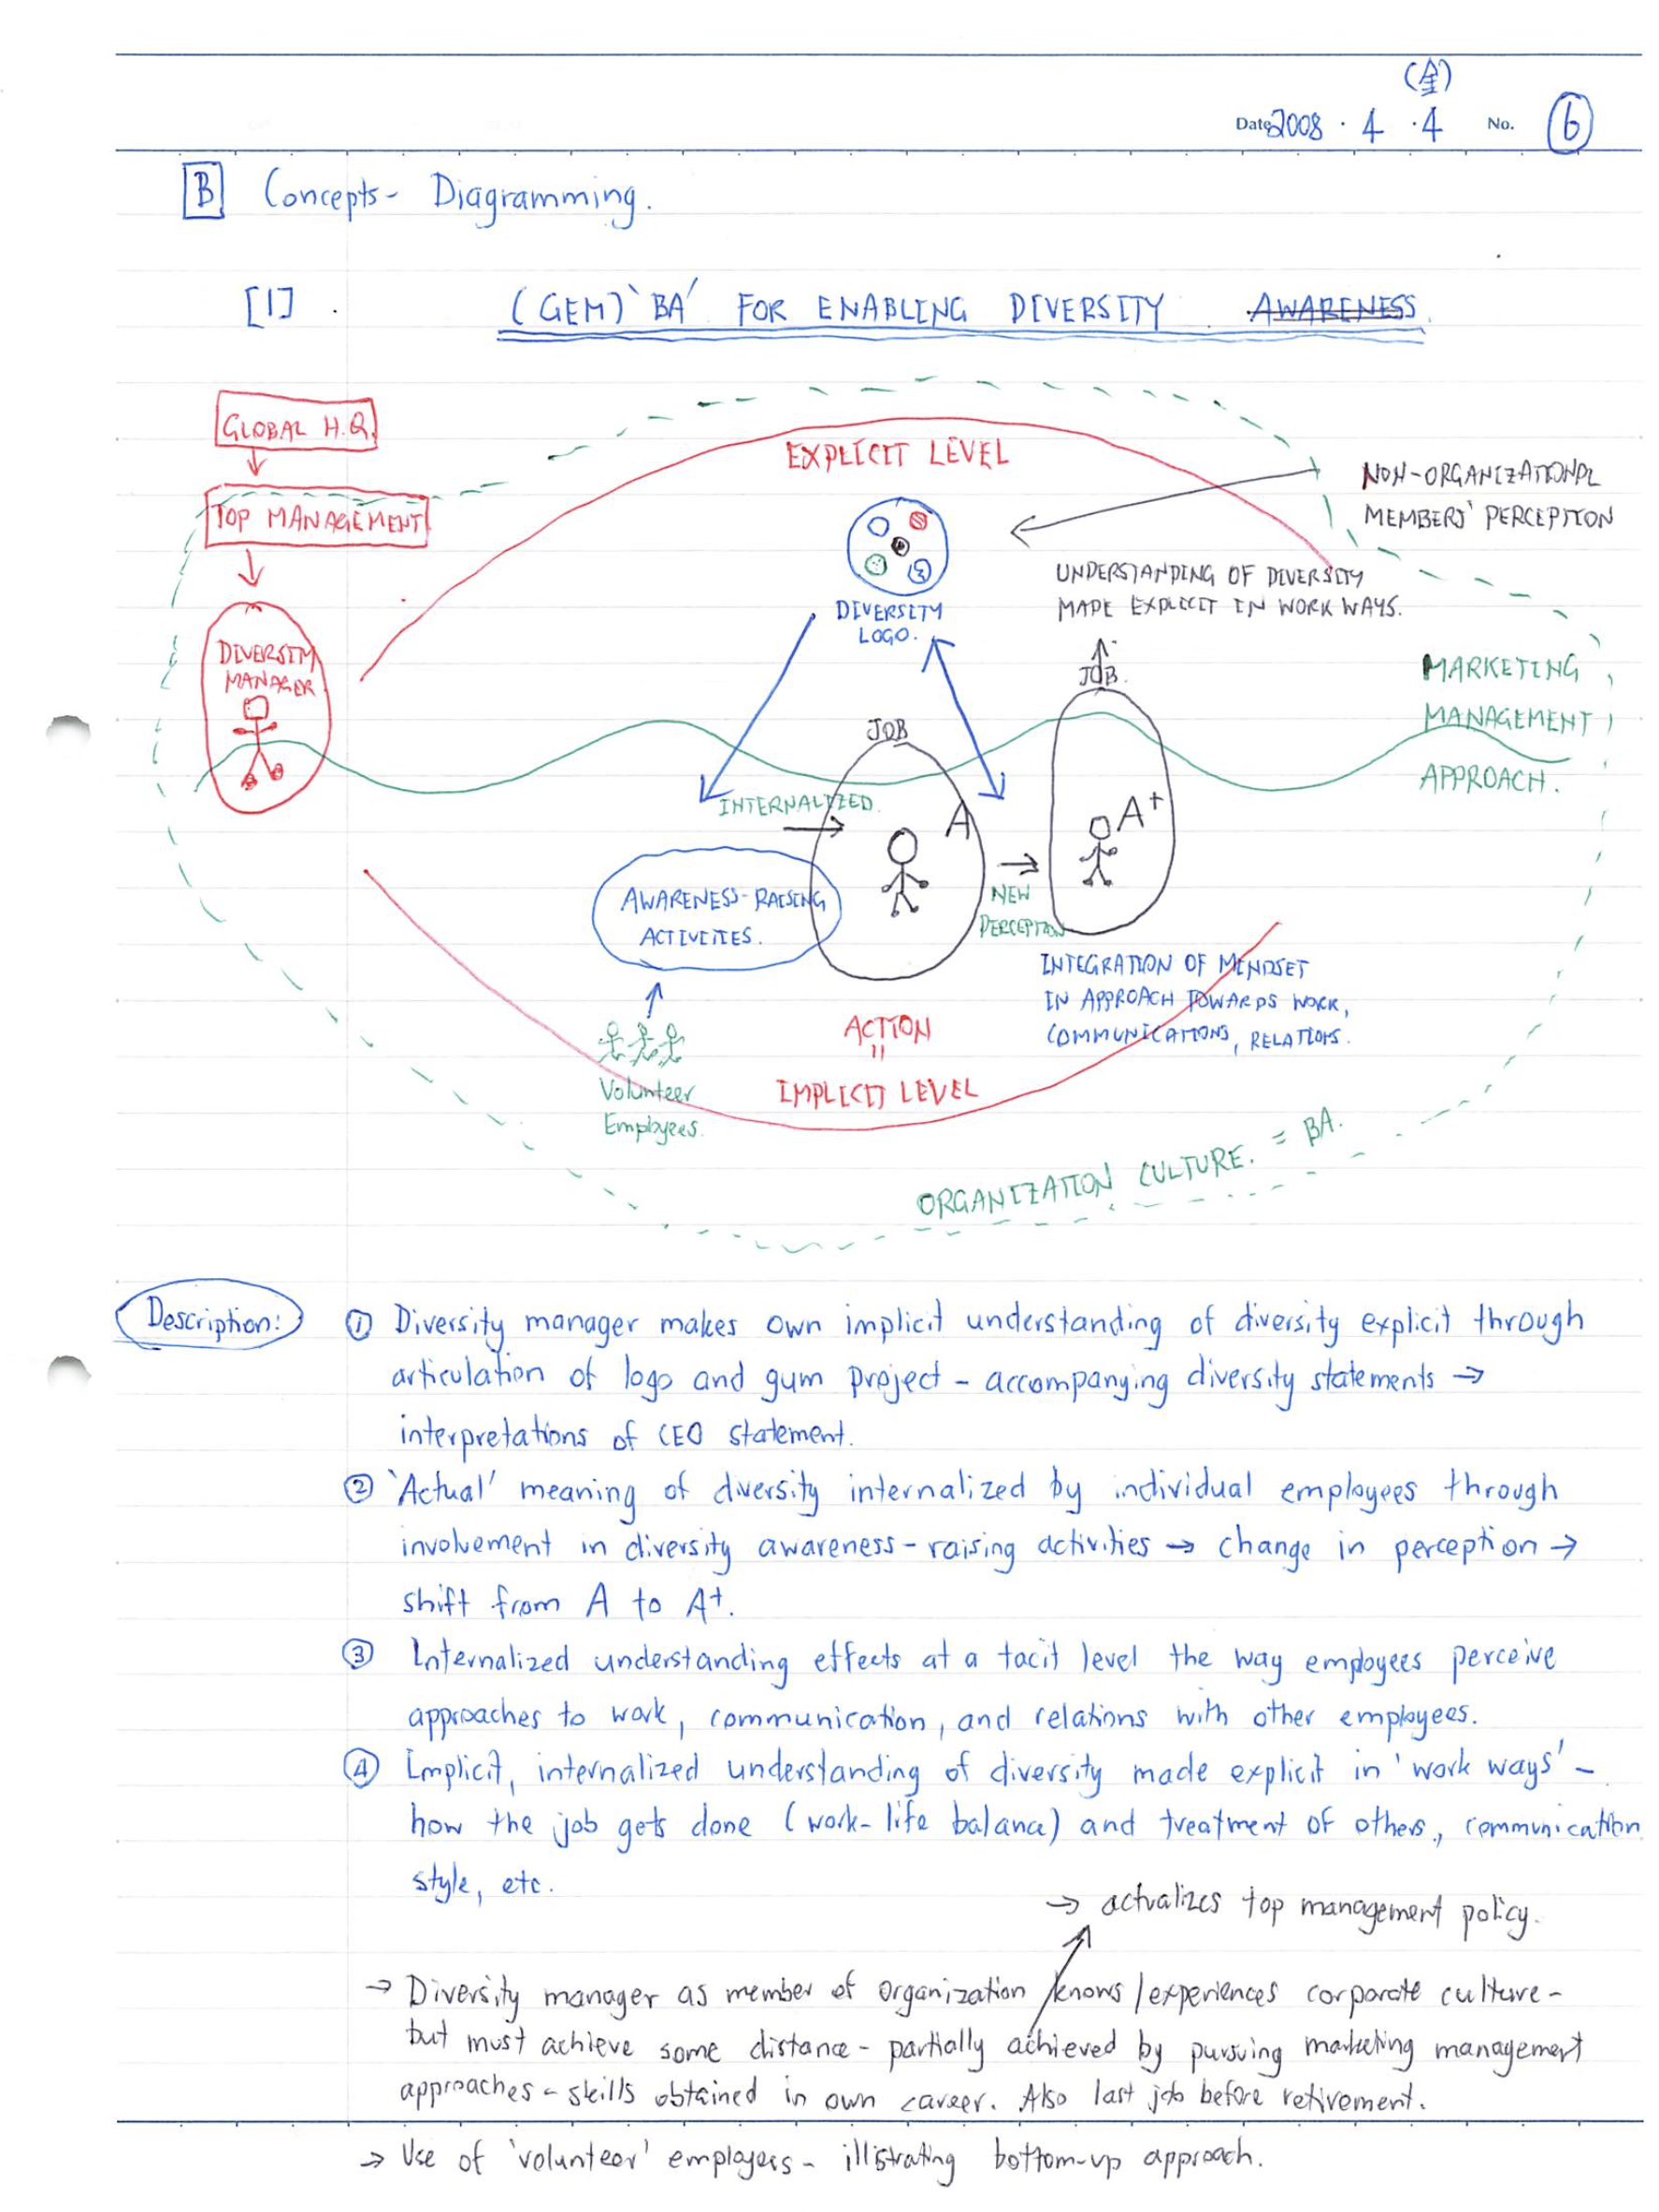
(1) After doing some line-by-coding in accordance with the Grounded Theory method advocated by Charmaz (2006), I would read the interview transcript while listening to the audio recording and try to find the processes in what was being discussed. In this case, how the diversity officer tries to create awareness about diversity in her workplace. I use a pencil to draw diagrams and include an explanation of the diagram.
(2) I would then put this all aside for a couple of days and revisit it again by drawing the same diagram in a 4-color pen. At this point, I am referring to what I wrote only (no reading interview transcripts or listening to audio recordings, except if there is an item that I need to make clear in order to complete the diagram). The general goal is to tighten the explanation. In this case, there is only a slight difference between the pencil diagram and the explanation. However, I realized that the upper section of the pencil diagram is a concept that needs more detailed attention separately. I came to realize this when started thinking about how existing theory may provide some insight into what is happening.
Results
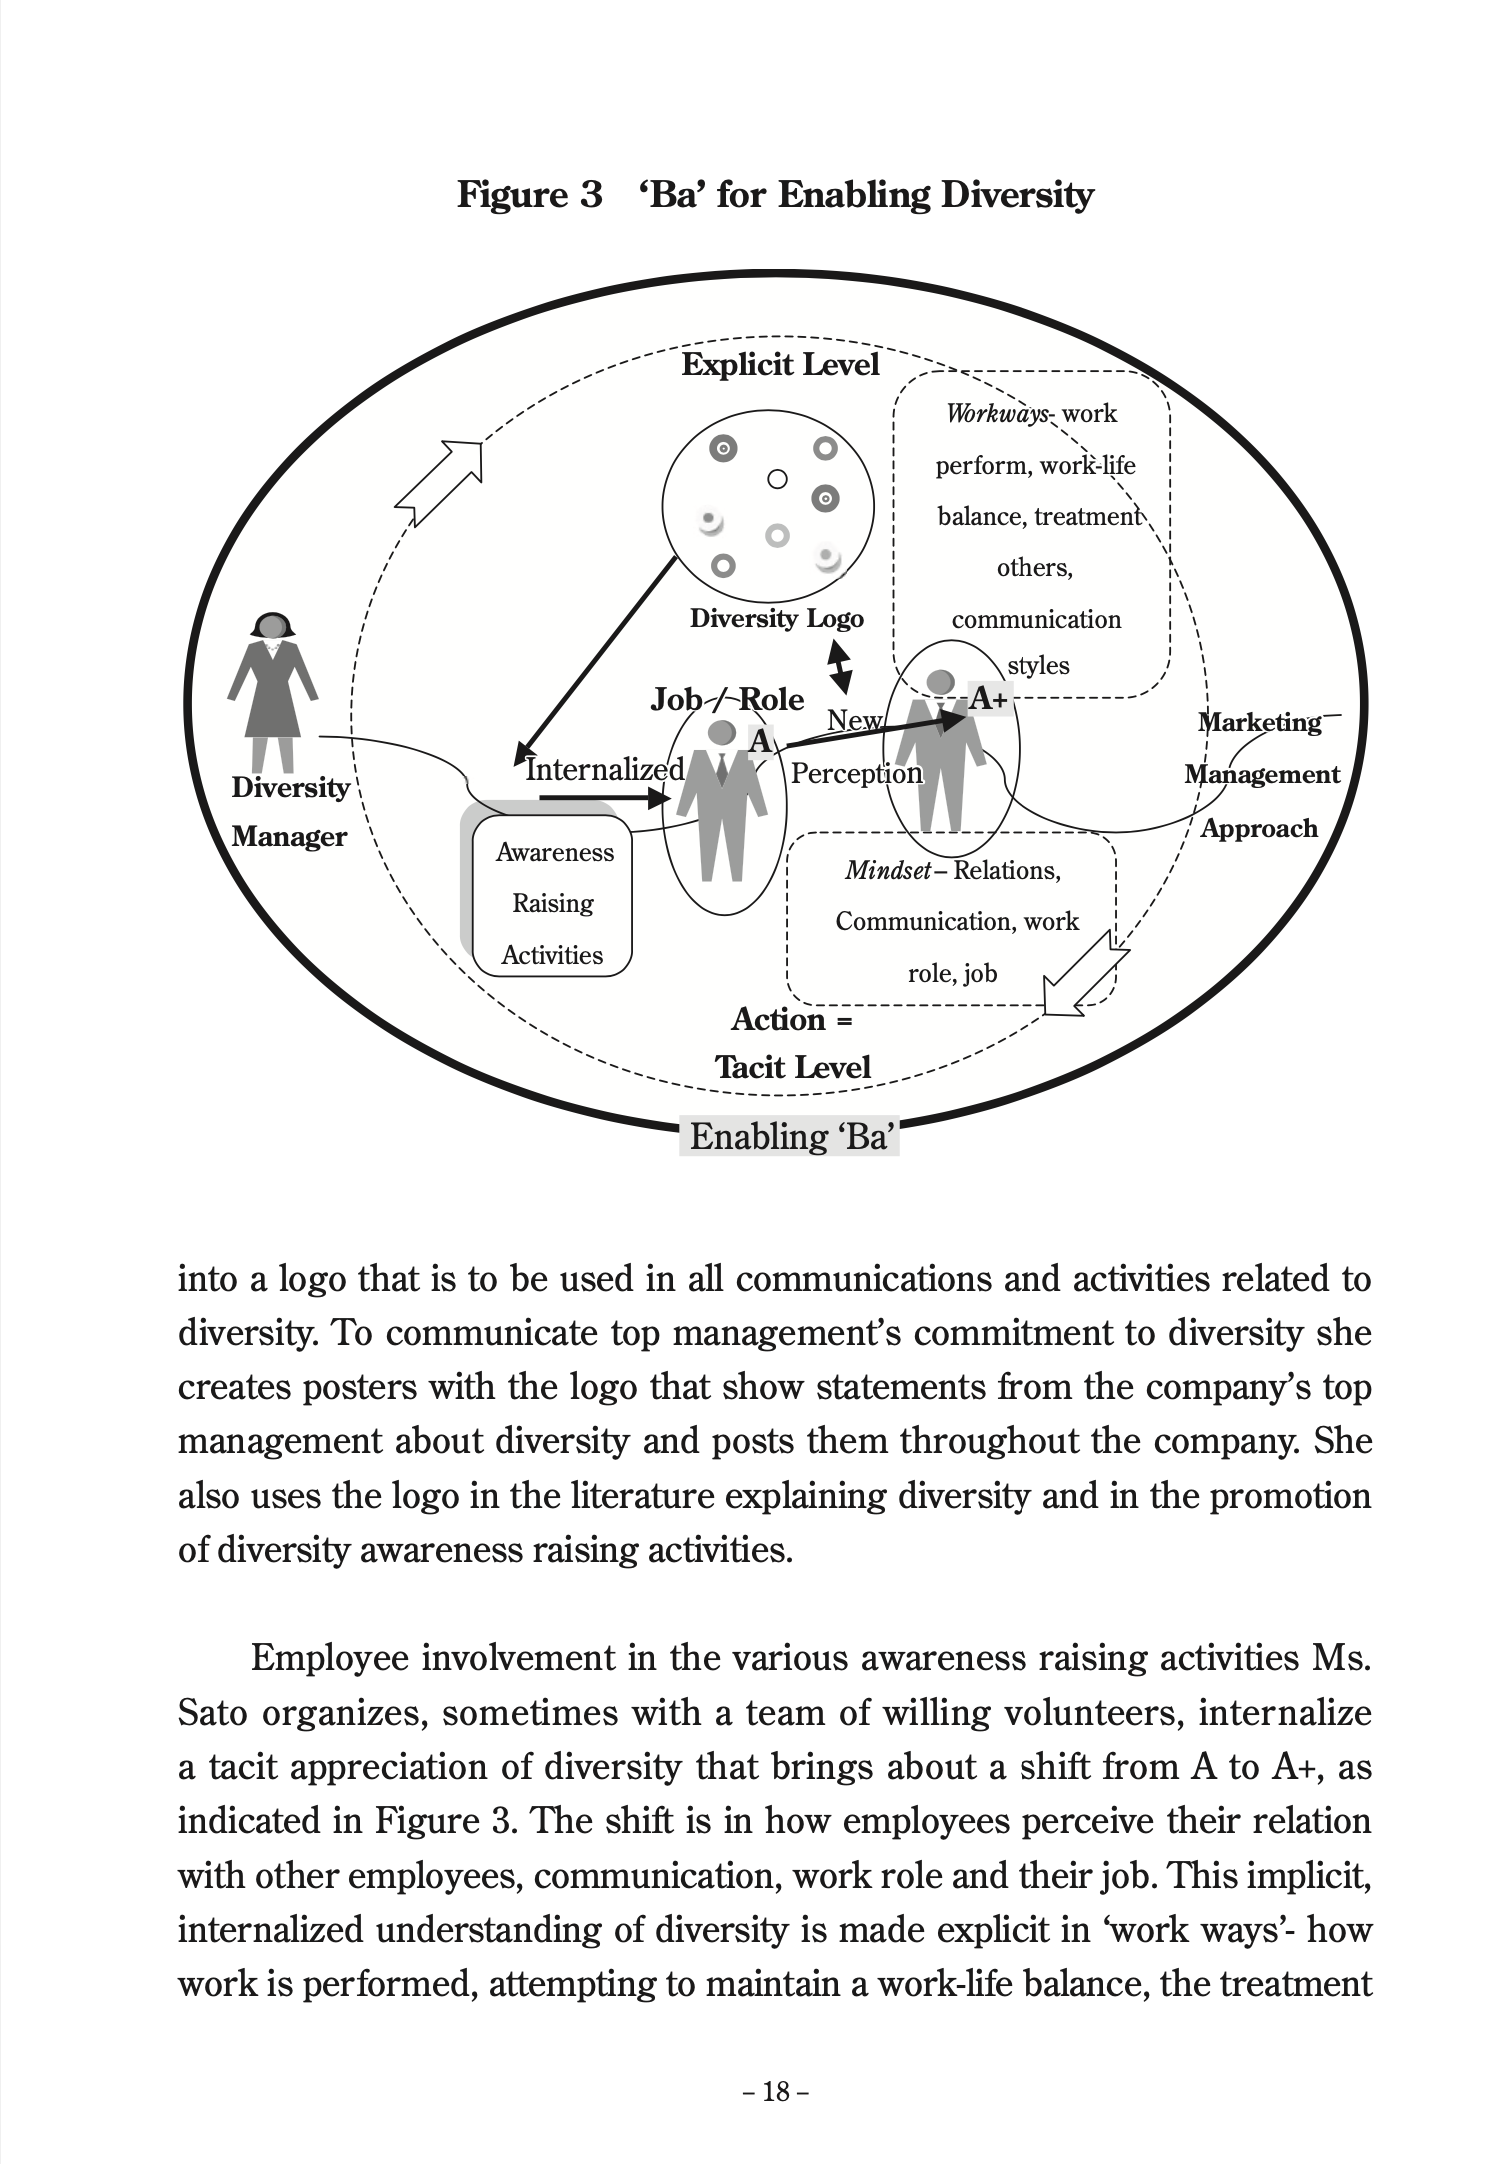
And here is how the diagram appeared in a working paper (McDonald, 2009). The working paper goes into detail about the linkages with concepts and theory in Japanese management studies.
Possible future use of a visually-orientated Zettlekasten
I am about to start a new joint-research project that draws on the same interviews and analysis. Insights will be compared with similar research conducted by a project member.
I am thinking of starting a visually-orientated Zettlekasten with this research project. What got me interested in doing this was because Yani Dutta mentioned in the YouTube video how visual Zettels were useful in sharing insights with her husband. I will have to do the same exact thing. Also, it evident to me from my past research is that I am a visual thinker.
Tools for creating a visually-orientated Zettlekasten
As I explained above, I hand-wrote diagrams together with an explanation of the diagram in a notebook. I then scanned the cards so that I have them in digital format. Recently I purchased a BOOX GO 10.3 and am working out a way to do this work on the device.
Overall, I find that working on analysis visually and writing explanations of the diagrams moves me along towards published research than if I try and work with text alone. Many of my colleagues in management studies in Japan seem to be the same. The problem I can see with creating a visual Zettle is due to the nature of diagrams themselves. Diagrams can be rich in content, representing sometimes complex notions or concepts. "A picture paints a thousand words". How do you define what is atomic in this case? What makes a Visual Zettle a Zettle?
References
Charmaz K (2014) Constructing Grounded Theory. 2nd edition. Introducing qualitative methods. London ; Thousand Oaks, Calif: Sage.
@Darren_McDonald Thanks for this post - very interesting description.
I like the combination of visual representations and text, as I usually find visual diagrams alone are too much to comprehend. Or, at least, comprehension can be helped along by suitable text.
I like the combination of visual representations and text, as I usually find visual diagrams alone are too much to comprehend. Or, at least, comprehension can be helped along by suitable text.
You might like to have a look at the Excalidraw plugin for Obsidian. Both text and diagrams are possible in the same note.
Hi, I am very new in this field,
but since I saw this huge disciplined discussion about a topic, which is very personal in kind of experience note taking (e.g., example images), I finally feel home
As mentioned, even a few handwritten words inside a computer based note can change the way, your brain is getting connected to that specific one. I like the idea, even if I am in my current state not able to afford enough time
@MartinBB@Terry Thanks for those comments. I do use Excalidraw, Mindmap and whiteboarding tools in Logseq, which can accomplish much of what you mentioned. However, the Zettelkasten Navigation tool looks interesting. Also, I have to check out the Excalibrain plugin.
Comments
@Loni Thanks for sharing the information on Eagle. I believe you can post links to commercial software here - many have done it. I guess it should have relevance to the ZK world and you should describe why you are posting, and then do it in a way that shares information rather than promotes a product. I believe your post above is a good example.
But to be honest, I don't know if there is a hard and fast rule on this in the forum.
Oh, how could I miss this ?
@analogue_man said:
A moodboard is an awesome tool and very, very fun on to make. You can not only add pictures, sketches and all, but also part of the real world. I used them when I design. Now, I take photo and keep the samples on a box and then add them into Eagle to make a design drawing.
(Mine looks like this one:)

The problem with printing is… money. You'll need a printer machine, inks, and all. It can be expansive in the long run. It might not be a problem for everyone, but for someone who works on a specific visual fields, it can become a huge obstacle.
The other problem with analog is anything that are not "real world" objects, pictures and text can't integrate it so easy. As the question is turned for visual thinking, it is not a problem, but sometimes it can emerge. I work a lot with music files to find inspiration, a 3D artist might have a need for other 3D references. But this problem is the same for a digital Zettelkasten as well, as a lot of softwares don't read a lot of formats neither.
So analogic Zettelkasten might not be the perfect solution for anyone, but it is a very tempting one. Don't look after me, I'll be back after sniffing paper, cheers !
You are totaly right ! I have read about this new mappings solutions. In french, we need a lot of typos which are unpratical to make however. A usable mapping for me would be "BÉPO" but I would have to learn from start and right now, I am on a production tempo for my novels and I need to be quick. I will (try to) learn this mapping after publishing the first one to see one deadline behind me.
Thank you ! I will keep this on my mind next time
You're welcome.
Alternatively, learn how hackers in cartoons learned to type so fast. Just kidding. I'll look into that someday. Thanks!
Sacha Chua recently posted about her experience with the SuperNote A5X:
https://sachachua.com/blog/2022/08/one-month-with-the-supernote-a5x/
Her blog category on the topic:
https://sachachua.com/blog/category/supernote/
I looked up the device and found these videos on the topic by YouTuber "pixel leaves":
The thing about Sacha Chua is that she's tinkering with the output of her SuperNote to generate textual representations of the notes as well. That might help with visual note taking and plain text Zettelkasten. She also applies custom color keys to the 4 grayscale output
The device has data import downsides, but Sacha got it working, so maybe giving this another year, it might be a useful combo with plain text notes.
Author at Zettelkasten.de • https://christiantietze.de/
Watching the video that @IvanFerrero posted at the start of this thread and reading everyone's comments had me revisit the analysis of interviews I conducted with diversity officers in Japan. Reflecting at how I conducted the analysis makes me think that creating a visual orientated Zettelkasten is more in line with how I work. Let me share a little of my analysis through the process to the final publication of the results.
The Process
(1) After doing some line-by-coding in accordance with the Grounded Theory method advocated by Charmaz (2006), I would read the interview transcript while listening to the audio recording and try to find the processes in what was being discussed. In this case, how the diversity officer tries to create awareness about diversity in her workplace. I use a pencil to draw diagrams and include an explanation of the diagram.
(2) I would then put this all aside for a couple of days and revisit it again by drawing the same diagram in a 4-color pen. At this point, I am referring to what I wrote only (no reading interview transcripts or listening to audio recordings, except if there is an item that I need to make clear in order to complete the diagram). The general goal is to tighten the explanation. In this case, there is only a slight difference between the pencil diagram and the explanation. However, I realized that the upper section of the pencil diagram is a concept that needs more detailed attention separately. I came to realize this when started thinking about how existing theory may provide some insight into what is happening.

Results
And here is how the diagram appeared in a working paper (McDonald, 2009). The working paper goes into detail about the linkages with concepts and theory in Japanese management studies.

Possible future use of a visually-orientated Zettlekasten
I am about to start a new joint-research project that draws on the same interviews and analysis. Insights will be compared with similar research conducted by a project member.
I am thinking of starting a visually-orientated Zettlekasten with this research project. What got me interested in doing this was because Yani Dutta mentioned in the YouTube video how visual Zettels were useful in sharing insights with her husband. I will have to do the same exact thing. Also, it evident to me from my past research is that I am a visual thinker.
Tools for creating a visually-orientated Zettlekasten
As I explained above, I hand-wrote diagrams together with an explanation of the diagram in a notebook. I then scanned the cards so that I have them in digital format. Recently I purchased a BOOX GO 10.3 and am working out a way to do this work on the device.
Overall, I find that working on analysis visually and writing explanations of the diagrams moves me along towards published research than if I try and work with text alone. Many of my colleagues in management studies in Japan seem to be the same. The problem I can see with creating a visual Zettle is due to the nature of diagrams themselves. Diagrams can be rich in content, representing sometimes complex notions or concepts. "A picture paints a thousand words". How do you define what is atomic in this case? What makes a Visual Zettle a Zettle?
References
Charmaz K (2014) Constructing Grounded Theory. 2nd edition. Introducing qualitative methods. London ; Thousand Oaks, Calif: Sage.
McDonald DM (2009) Pioneering Diversity Management in Japan: The Experience of ‘Company K’’s First Diversity Manager. Research Papers, Institute of Business Research, Daito Bunka University (No. E-48): 1–27. (Download link: https://www.researchgate.net/publication/259761002_Pioneering_Diversity_Management_in_Japan_The_Experience_of_'Company_K''s_First_Diversity_Manager
@Darren_McDonald Thanks for this post - very interesting description.
I like the combination of visual representations and text, as I usually find visual diagrams alone are too much to comprehend. Or, at least, comprehension can be helped along by suitable text.
You might like to have a look at the Excalidraw plugin for Obsidian. Both text and diagrams are possible in the same note.
I use below 3 plugins as my visual Zettelkasten solution in Obsidian: (showcase as above)
Hi, I am very new in this field,
but since I saw this huge disciplined discussion about a topic, which is very personal in kind of experience note taking (e.g., example images), I finally feel home
As mentioned, even a few handwritten words inside a computer based note can change the way, your brain is getting connected to that specific one. I like the idea, even if I am in my current state not able to afford enough time
@MartinBB @Terry Thanks for those comments. I do use Excalidraw, Mindmap and whiteboarding tools in Logseq, which can accomplish much of what you mentioned. However, the Zettelkasten Navigation tool looks interesting. Also, I have to check out the Excalibrain plugin.