Zettelkasten Graphs and Usage

My Zettelkasten is full of maps. I use them in various ways. Some of them are part of my Permanent and some are part of my Structure Notes. Today, I tried to bring some order to my visual structures.
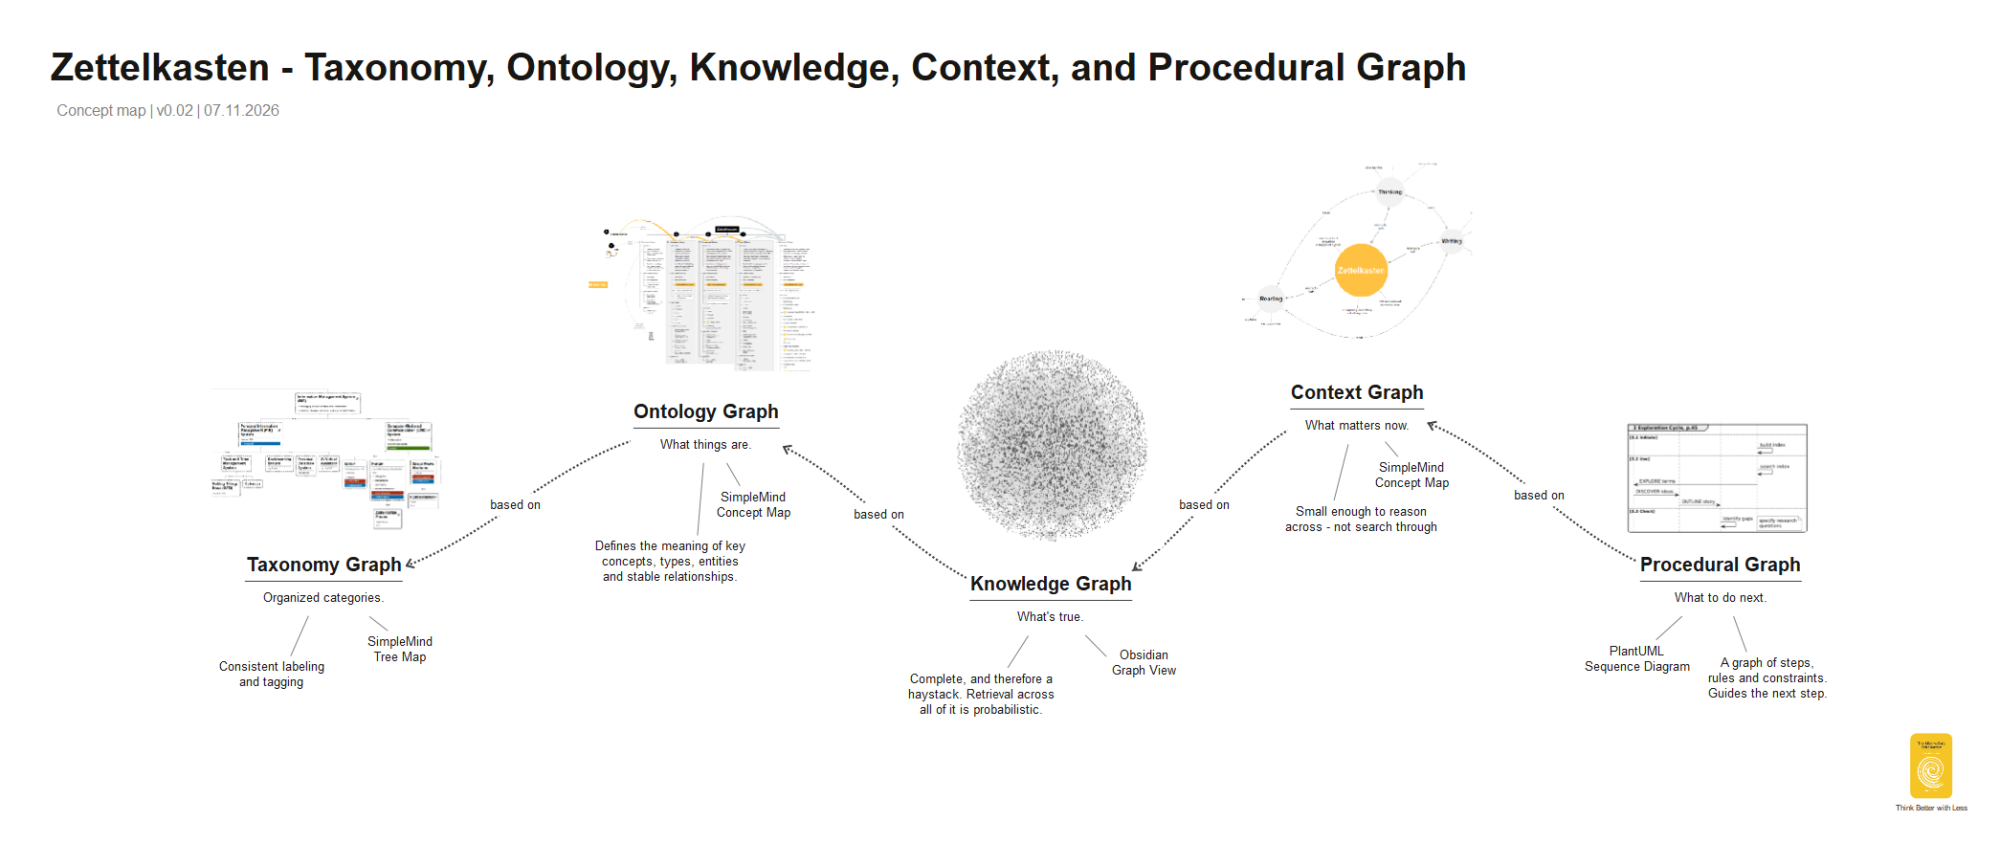
Taxonomy Graph
Ontology Graph
Knowledge Graph
Context Graph
Procedural Graph
Do you use any of these visual structures? Or a textual equivalent?
Edmund Gröpl — 100% organic thinking. Less than 5% AI-generated ideas.
Howdy, Stranger!
Categories
- 3K All Categories
- 153 Research & Reading
- 709 The Zettelkasten Method
- 12 Knowledge Work
- 102 Writing
- 475 Software & Gadgets
- 161 Workflows
- 734 The Archive
- 16 Plug-In Showcase
- 88 Resolved Issues
- 225 Projects Logs and Journals
- 86 Project: Zettelkasten.de
- 53 Critique my Zettel
- 181 Random
- 376 Introduce Yourselves!
Comments
These types of graph (or some variant of them) have been important for me at some stage of my work.
You call the knowledge graph "complete, and therefore a haystack", but it could also be a local graph, constructed either automatically or manually. As an Obsidian user, do you ever use a local graph view, limiting the depth of links so that the graph is not of the whole vault, and so not a haystack?
You use a based-on link between these types of graph, but I assume this has a vague meaning, because I don't see how all these types of graphs are all based on another type of graph in exactly the same way.
Thank you for your valuable hints, which I really appreciate. Here is an update:
Edmund Gröpl — 100% organic thinking. Less than 5% AI-generated ideas.
Could you share an example of a note or task where the procedural graph changes what you do next, compared with following a plain checklist?
Here is my example: https://forum.obsidian.md/t/review-and-revise-notes-but-how/86820, created: 2022-03-24, published: 2024-08-03.
To be honest, a plain checklist would achieve the same thing if it is like a software script with loops and decisions, which is essentially a linear list of instructions.
Edmund Gröpl — 100% organic thinking. Less than 5% AI-generated ideas.
It sounds even better if you call it pseudocode. :-) For example:
while thinking:
    (re)think
    while visual is not coherent:
        (re)draw visual
        while note is not coherent:
            distill note content
            connect note to other notes
            (re)write note
    print note
    pin note to wall
    view on wall
    wait
    review
    get insight 💡
With the right tool you can render pseudocode as a Nassi-Shneiderman diagram:
This visualization makes it easier to recognize structures like loops and decisions.
Sequence diagrams and flowcharts with swim lanes add visual context that is difficult to convey with plain text.
Formal visualizations reduce ambiguities because they only have a limited number of well-defined structural elements.
You digging into these quirky dev tools -- I haven't thought of Nassi-Shneiderman diagrams in well over a decade, totally forgot about them. That's super useful for many things, thank you
Author at Zettelkasten.de • https://christiantietze.de/