Two images tell you a lot about graphic views and Zettelkastens that are actually used

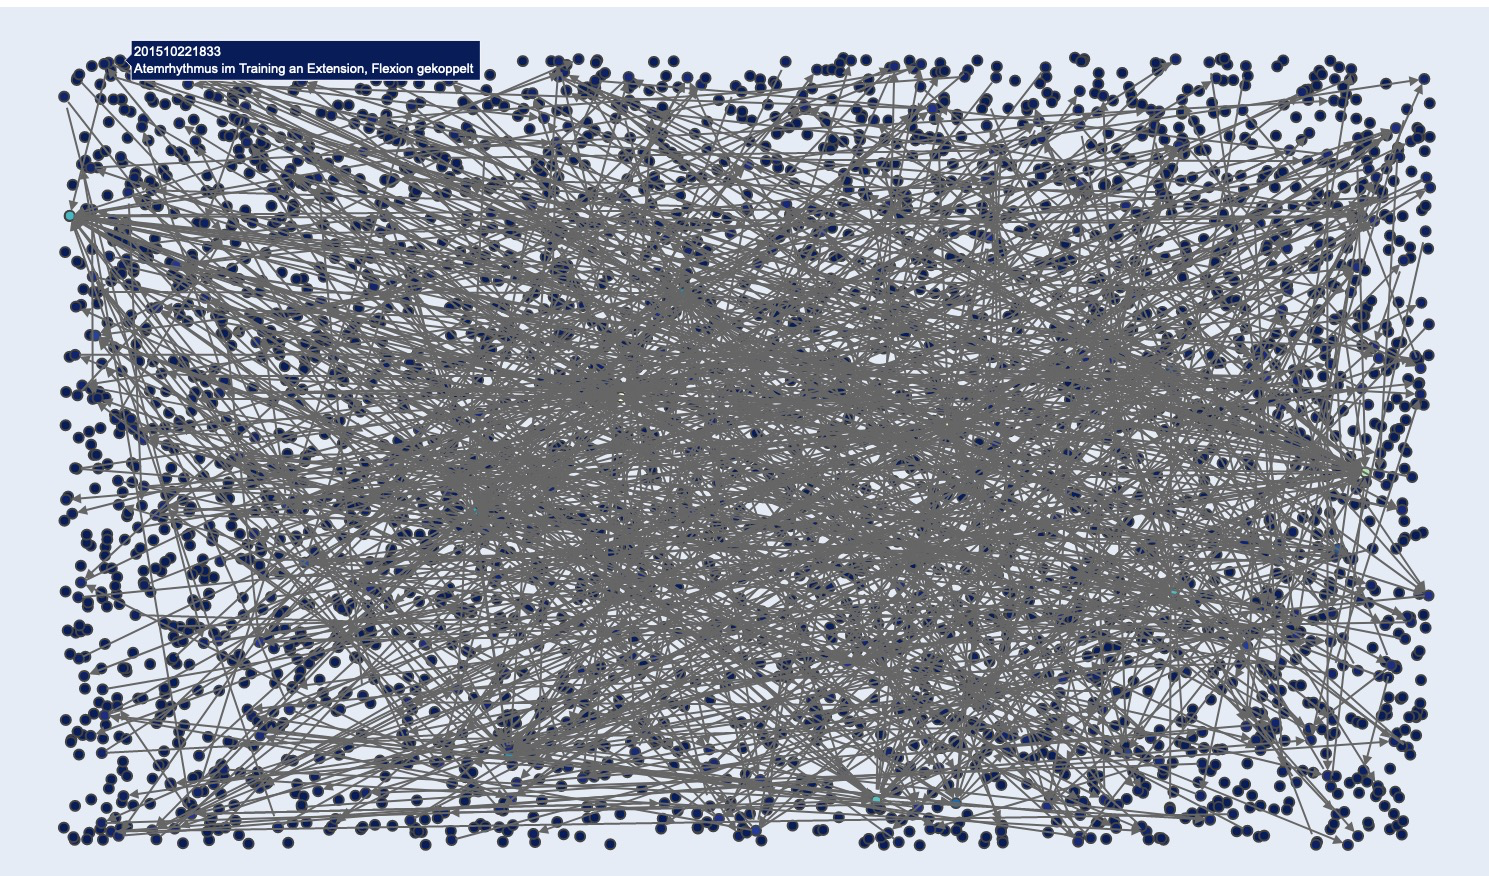
The "bigger picture"
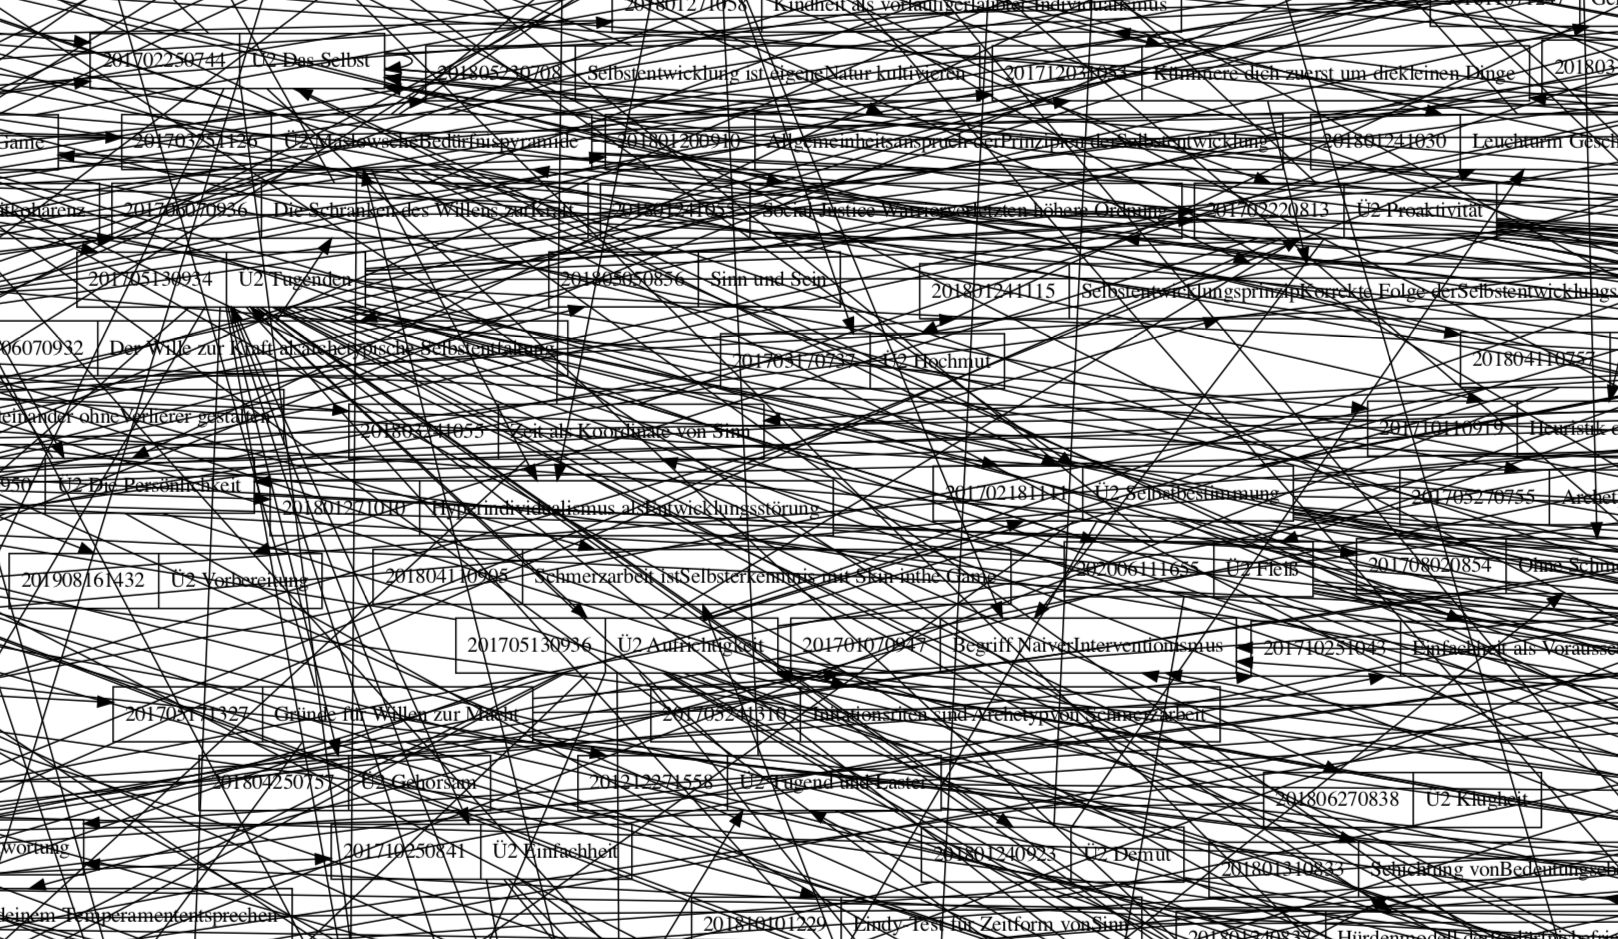
A close-up
The value of a graphic view decreases over time. You cannot expect to have a life long system and rely on a graphic view of your ZK. You have to make a decision. Do not count on any graphical interface if you plan to take your ZK to any meaningful complexity!
I am a Zettler
Howdy, Stranger!
Comments
these are bad examples of graphs to represent data. I doubt that these views had any value at any time. What information can be drawn from these pictures? None.
That first image looks like obsidian, is this correct? Are these maps 3 dimensional or 2? If this is a 2D map, why are some orphaned notes closer to some notes than others?
my first Zettel uid: 202008120915
It's the intereactive output of zkviz, which was introduced and discussed in this forum a while ago: https://github.com/Zettelkasten-Method/zkviz/
It's too much for the JS plot library to actually pan around, though")
Author at Zettelkasten.de • https://christiantietze.de/
I can only aspire to have such a deeply interconnected note archive that any graphical representation like this is so worthlessly chaotic.
Back in June of last year, I tried zkviz, and even then with only ~600 notes and my limited connection skills, the views were unintelligible. Maybe if you could somehow limit graph views to only ~25 notes but that would not be useful as it would not include all connections. In working with the project of @BasilPH's vizel I found that my note archive is made of 40 components with all but 42 notes being in component 1!! That would mean a graph including ~540 interconnections in order to be complete and with that much chaos, it would be useless.
And all this is with a puny number of notes in my archive.
Will Simpson
My peak cognition is behind me. One day soon, I will read my last book, write my last note, eat my last meal, and kiss my sweetie for the last time.
My Internet Home — My Now Page
A large graph that displays all your notes and connections may be barely useful. But, personally, I find "local sub-graphs" (like this one) very useful, and these further help me not to get lost.
So IMO, when visualizing notes, the trick is to focus on sub-graphs, e.g. those generated for the currently displayed/selected notes, or for another sub-group of notes, like those belonging to certain tag(s) or citekey(s), etc.
When displaying the full corpus of notes, it's usually better to visualize some grouping parameters (like tags or citekeys etc) instead of individual notes.
oh, i didn't know about that. It looks great. I think it is more useful after applying some filters first. I wouldn't use it to view the entire Zettelkasten.
I was thinking, that maybe one scenario where looking at the entire Zettelkasten could help would be in assisting with balanced structures. 40 components aren't too much chaos to look at, and with one growing into overwhelming dimensions could be a friendly reminder to create a new entry point there.
my first Zettel uid: 202008120915
I'm catching myself to think like a programmer when I look at graphs like the limited graph from my latest Epstein episode last year: I'm looking for patterns where it looks messily interconnected (coders call this "Big Ball Of Mud" architecture), because I'm trained to try to figure out self-contained "modules" in code. These may interact with each other, but not willy-nilly. They have to use well-defined interfaces, which would make a fuzzy ball transform into smaller balls with lollipop-stick connections between them.
The thing is: I don't even know if that is something useful to aspire to! In programming, you want to keep components atomic, isolated, and comprehensible to future readers. An interwoven web isn't comprehensible. And that's in part what makes a Zettelkasten fun. So practices like "keep changes local" and encapsulate what belongs together into cohesive modules -- these might actually hurt in my Zettelkasten. But I don't really know that, either")
That's what I would like to try with a graph view, though: to untangle and sort and prune. This has a nice ring to it, because these terms are laden with connotations of virtue and being a good boy; I would have to check if that's really helpful, though!
The Epstein graphs were a novelty and a bit of eye candy, but I wouldn't know what to do with the graph in practice. Traversing a large structure note and its N levels of "hops"/links to other notes this way might be easier for me to keep in my head than a long, linear list? Again, that's just me speculating (and knowing how well I respond to visualizations).
@zk_1000 What would you actually do with a more limited visualization, a selection of notes?
Author at Zettelkasten.de • https://christiantietze.de/
I think about this a lot and have been somewhat skeptical of graph view since it came out with Obsidian for this exact reason. But I'm not completely sold that graph view is useless. I think something along the lines of Quid (text based data analysis), which will show you clusters.
Obsidian has the option to localize graph view and chose how many nodes out you want to display. I'm not sure how to utilize this but this could be helpful for seeing what a specific area of your zettelkasten looks like. Here is my note from awhile ago starting to explore this topic.
Graph view exists and people use it in data science, so it obviously works. These programs just add it on as a feature and don't think about how it can best be used in a workflow beyond being a toy. In this situation, you need some sort of abstraction algorithm for it to be useful because the only way large network visualizations to be useful is to illustrate hidden clusters.
Interesting, I like the notion of a limited citekey or tag view like you show. I can see how this helps see the completeness or gaps in an area of study.
This would be valuable, and wouldn't you be in a way ignoring other non-matching citekey or tagged notes? That could be a good thing; by limiting the scope, you can increase focused attention.
@msteffens, what graphing package do you use for this?
Will Simpson
My peak cognition is behind me. One day soon, I will read my last book, write my last note, eat my last meal, and kiss my sweetie for the last time.
My Internet Home — My Now Page
I'm not sure I was clear enough in my description of the components in my note archive.
The 42 notes not in component 1 are orphans. At the time, I had one component with 560 notes. and 42 components with one note in each. In reviewing these 42 notes I saw they were the result of my laziness and ineptitude and I've since done the work to connected them with the main component.
I'm not sure what you are getting at with the suggestion of adding an entry point when a cluster of notes grows. Can you educate me with an example? Or maybe I misunderstand.
Will Simpson
My peak cognition is behind me. One day soon, I will read my last book, write my last note, eat my last meal, and kiss my sweetie for the last time.
My Internet Home — My Now Page
@Will Yes, exactly. In my example, the graph only(^1) shows those notes that have been found by my current search query.
(^1) However, the graph additionally displays notes (with a dashed border) that are linked from any of the found notes but which are not part of the current search results.
I'm using Graphviz. Graphviz btw also allows to set a link for every node in the graph. That way, clicking a node can again open the note in your note editor app. So the graph can also be used for navigation which I find very useful.
In theory many things come to mind. I'll have some fun and share my prototypes later. Some of these don't scale well, i'm afraid. I want to try them anyway. I have to walk before i can run.
@Will are components like topics / areas of study? It doesn't seem to be related, but i was thinking that a topic can grow too big to find a note to start a train of thought. Then, a new entry in your register could split this topic in two branches.
Right now, i have more questions than answers")
my first Zettel uid: 202008120915
If we use graphs why not in the style of thebrain:
@msteffens: Is this what you meant?
@myn_user the problem with that is the brain triages the information in a way. You might be able to think 200 great thinkers, but they won't all flood into your brain at once. They would with a graph view though and overwhelm you. The brain prioritizes heavily used and connected pathways over others.
You'd need some sort of Algorithm to track what great thinker notes you visit the most then show those. Or you'd need an extra modifier, such as great thinkers in X subject. Or you could have the graph view display the top 20 great thinkers with the most links pointing to them.
@myn_user Restricting the graph to only display connections for the selected note (up to depth n) can be one way to focus on just a sub-group of your notes.
What I meant, however, was to restrict the graph to all notes matching your app's current search query (like in this example).
But both approaches would be useful.
There is a threshold of complexity beyond which a graph is increasingly useless. Obsidian compensates for that by allowing you to filter a graph using any combination of Boolean search, tag search, a flag for attachments, and a flag for orphan files. You can adjust the visual display, as well, with node size and distance among others. I would bet the graph in the original post would become far more useful when such filters and parameters are applied.
In the terminology used with the
vizelapplication, a component is a group of interconnected notes that touch each other either directly OR via a link OR a link of a link, ad infinitum. It turns out, all my notes connect. I can get to any note from any note via links.Will Simpson
My peak cognition is behind me. One day soon, I will read my last book, write my last note, eat my last meal, and kiss my sweetie for the last time.
My Internet Home — My Now Page
No. Obsidian failed, too. But this was done with GraphViz.
I manually checked. Quite some connection were lost somehow. But it would only make the result worse.
This is another try with different parameters:
This is one of the issues. Those are not all notes. However, you can see (translation of the center note: Personality of a creative creator)
It is not a very interconnected structure note. Many other notes would span their wings way more across my ZK.
At this point, I see your suggestion as the only promising use of visual representation.
This is the script Christian used for the Range videos. It is only two nods deep from the center note.
I am a Zettler
@Sascha Thanks for bringing this up; I've tried the graph view on a couple of other apps and found them essentially useless. They are fine for a small number of nodes and simple connections (such as shown by @msteffens and @myn_user ), but once beyond that limit, more confusing than helpful.
I've come to like the non-visual aspect of following links in The Archive, anyway. It feels more like a voyage of discovery than of my brain trying to do a pattern recognition exercise. Not that the latter is without value, but I'm not sure these node-connection graphs help even with that.
If I'm going to filter what I'm seeing by Boolean searches and/or tags, I'd just as soon see the resulting list of resulting zettels, click on one, and again, start following links. If there are too many zettels, I just increase the specificity of my search.
This user shows how a complex graph can be useful. Go to minute 06:00.
@miguelmarcos
This is not a complex graph. Rather a simple and tidy one. And you see that her notes are rather large, not atomic and partly centered around sources and not ideas. (For comparison: She seems to have a couple hundred notes which are not heavily interlinked. The picture with "Personality of a creative creator" (Ü2 Persönlichkeit eines Kreativ-Schaffenden) in center is only a small part of my Zettelkasten (2000 notes). I have over 9,5k notes at this point in time.)
I don't want to discount the use for simple graphs like the woman showed in this video. The last point ("I quiz myself...") is interesting for project-centered projects. As a PhD you need to train your thinking revolving around both ideas and names. However, if she continues to use this one system the breaking point will come soon.
I am a Zettler
I won’t quibble about what constitutes complex. I’m sure everyone has their threshold. What I believe still holds is that well designed graph views are powerful if the note collection is richly linked and organized because it will display connections in a way that a flat hierarchical view cannot.
It is not something up to a personal choice. It is an intrinsic trait of a Zettelkasten that show up pretty quickly. The possible number of connection within a Zettelkasten grows factorial.
I am a Zettler
For what it's worth: I actually learned something from the pictures, @Sascha. Your point was made using a graph.
A (filtered down) graph view can be an aid in navigating notes and discovering nth-order Links. Nothing that couldn't be done in a different way, of course, but nonetheless a way to do this. Just to give one (more) example. More options to display notes, navigate through them, work with them, is certainly not a bad thing.
Hm. This seems like a bad argument. Care to explain your point @Sascha ?
As regards to "thinking like a programmer" (@ctietze): Why would a highly successful thought style (Denkstil) be a bad thing to apply to your notes, when it's uncertain if it's a bad thing? Isn't that something to try out rather than avoid? I feel like this argument could otherwise be made in any case where there is some expertise on the one hand and uncertainty about the applicability of said expertise on the other - and I'd say I would rather people'd try out unproven things.
I wasn't a fan of a graph view at first, but with only a few toggle-able filters, it already has practical applications.
Just watch between 6:20 - 11:00 for two examples of practical applications (using Obsidian) in this test note kit.
There are certainly more too; that's just a sampling. Of course not all graphs will have the same feature-set, but hopefully this adds to the discussion of where we might find value in using graphs.
Well, refactoring and restructuring parts of a web of dependencies (here represented through note links) could be useful. When I link from
AtoB, and over the years add more to the topic thatBwas covering and eventually have a structure noteB_OverviewNote, maybe one day it'd be time to replace the link fromAtoBwith a link fromAtoB_OverviewNote. Depends on the link context, of course -- was it about a detail or was it just to point me to another, related topic?As a programmer, I'd avoid to connect some sub-component of a module with something from another module. I think that when you outright try to avoid links from a very specific content note to another very specific content note, you're missing out some interesting connections. I cannot see how e.g. applying the Façade Pattern to notes would help in this case to protect one topic department's content from another deparment linking into it.
I don't want to throw out the baby with the bathwater and never try to change the link paths. Editing links and "cleaning up the graph" might still be useful.
But zealously applying patterns of abstraction from programming to notes would create more hierarchical structures; and one idea behind this approach in programming, information hiding, I'd stipulate, is detrimental to what you want to do with your Zettelkasten. You don't want to hide information when you link; you sometimes want to make connections really strong and obvious, even across topic boundaries (aka between departments), and so to speak "leak implementation details". (Hard to come up with good examples for this; I think of a note cluster about empirical study design of some sorts, and then a note from a different department, say hermelin breeding, to link to a very detailed note about study design as an inspiration to approach optimal rabbit reproduction. That would "leak" the study details into the hermelin breeding deparment. Hypothetical examples like this are a all a little harebrained (...sorry...) but but I hope they illustrate the parallels at least a bit.)
Author at Zettelkasten.de • https://christiantietze.de/
It is not an argument but a statement that the argument I am refering to is not valid. So, some premises:
Christian's reasoning is the result of our talking. To answer your first question: A succesful thought style is only successful for its specific area. To expand: When Christian and I talk, I have very often the benefit of naivity. The issue of backlinking is a perfect example for the problem of this thinking style if applied in a different field:
Christian presents himself too humbly. He is smart and even smarter within is specialised area. However, each thinking style is very limited. The problem Christian ran into was that he applied already existing concepts to a problem that lies in the realm of novelty. He missed the first step of attacking a problem: Naive perception which opens up divergent thinking.
I didn't show Christian anything. We thought about an issue together and our different styles of thinking added up. In this case, I came up with an answer, in other cases he comes up with an answer.
@nickmilo22 Why are non-existing files shown if you filter for tags? I try to replicate that but If the file does not exist how can it have a tag? For example, if you filter for #habit how can you make "Flyweel Effekt" show up?
I am a Zettler
@Sascha Can you be more elaborate? What I see is an opinion "disguised" as a statement: I see a latent argument here. You do not believe that "What I believe still holds is that well designed graph views are powerful if the note collection is richly linked and organized because it will display connections in a way that a flat hierarchical view cannot." Why? Your premises seem incomplete and does not account for the fact that the opposite could also be true. In what way do you disregard those oposing premises (the alternate view can be clarifying/relevant/have more power than the original)?
Applying concepts from one field to another is surely not a simple matter that just works blindly. As @ctietze showed: Not all patterns or heuristics will work in every case. This is true for all software, too. But it is also not the case that concepts would never be applied to different domains - in a more or less transformed way. I mean, the whole notion of a "knowledge structure" points in this direction. Seeing clearly the different domain for what it is and then mindfully see what is applicable and what is not is knowledge work. If this is true it's also true for the programmer's thought style. A thought style is what connects a thought collective, yes, but that doesn't mean that a thought style is also bound to just one topic. And this seems to especially hold true for the programmer's thought style as the pervasion of code in all our everyday lives shows, I'd say. Is this always an earned success in the sense that things get always only better - in every sense of the word? Maybe not. Sometimes it gets cheaper, sometimes it gets faster, sometimes it gets easier, etc. But the applicability of thinking in coding concepts seems pretty far reaching.
Yes, applying concepts from one domain has to be done critically and mindfully. But this is always true.
And I think this is wonderful - what a great situation to find oneself in. But this doesn't mean that a third party has to agree with the answer you two came up with in every regard. To be honest: I am not sure I know why you thought to mention this.
I wonder if this kind of limited 2-3 node deep view could be a useful tool for novel idea generation?
I imagine that as the nodes get further out they might be linked more and more abstractly from the centre node. It could be interesting to look at the centre node and then look at the most peripheral x nodes in their entirety, and think about the chains of thought/logic/arguments etc that link from the centre to the periphery, even if there is a novel thought that could link it directly, and if any of these chains are worth exploring in more detail in a written article/blog post etc.
Though not all peripheral nodes would yield immediately interesting thoughts and connections so there may be benefit to be able to rapidly skim the peripheral nodes in a graph view rather than needing to follow the links one by one.
I think I've seen a previous post where the nodes are actually the note names, which would make skimming easier.
This is not the original claim. The original claim is:
My premises are not incomplete because this statement is founded on nothing but hope (I guess?).
There are other possible properties of views. With no foundation (evidence or argument) it is enough to point out other possibilities.
Friendship comes first.
I am a Zettler
@Sascha That is super weird.
versus
Hö? Are we seeing the same thing? Didn't we both just copy and paste the same sentence?
Regardless of that: So you reject that claim because it is expressed as hope? Even though the sentence structure expresses a causal relationship? And your premises are not incomplete because a counter example exists to the original claim? Is that the meaning of "not incomplete"? All of this feels like a spirit of the law/letter of the law thing to me. And I wish you'd be more a spirit of the law guy, I guess.")
It's not the hill to die on for either of us, I'm sure (I hope, I guess), but I would've wished for a little bit more "yes and…", instead of "computer says no", especially without explaining it properly: "I don't want to engage with claims expressed as hopes. Can you elaborate and/or give some evidence?"
Awww, how cute.