Visualizing your ZK stats

I was messing around with R today and made did some plotting of my usage and engagement with my ZK over the last two year. All it needs is a directory with .md files and consistently named zettels with the YYYY-MM-DD format that @ctietze and @sfast advocate.
Write up and code here:
https://www.alexchamessian.com/post/visualizing-your-zettelkasten/
What other metrics would you want to explore and visualize?
Post edited by achamess on
Howdy, Stranger!
Comments
That's cool! Something that tracks the connections would be sweet. Since you cannot take a 10-year-old Zettelkasten and calculate accurate numbers for each of its 10 years individually, due to the nature of structural changes and re-wiring notes over time, most connection-related numbers would have to be calculated e.g. daily; but if you calculate whatever number for 2017 and ignore all Ids with 2018, 2019, 2020, that might still be a good approximation.
Maybe cyclomatic complexity is also interesting? https://en.wikipedia.org/wiki/Cyclomatic_complexity
Author at Zettelkasten.de • https://christiantietze.de/
@ctietze Thanks! With your programming expertise, I'm sure you could do a lot of interesting things (maybe an analytics dashboard in the Archive for the future?... Or a "Pro version")
But the date-based ID has a lot of benefits for analytics since everything is sequential.
To your comment above, I'm sure it wouldn't be too hard to look inside each zettel file and extract the ID links to other notes. The assumption here is that, as time goes on, you link new zettels. Of course, this breaks down when you link to zettels from before the creation of the one you are searching in. But it'd give you a rough sense of the link growth.
I version control my ZK with Git. If you did daily commits, that would be the best way to do this. More advanced than I can code (right now) but I'm sure someone could do it.
There are all kinds of tools for text analysis. If I had more time, I'd play around more.
If you or anyone likes R, this book was was very helpful
https://www.tidytextmining.com/
Lots one can do. The question is now, what does one learn from this? How can this help you in your knowledge pursuits?
I decided to make a similar analysis on my Zettelkasten. The setup and notes predate my knowledge of Zettelkasten... it is kind of obvious when I learned about Zettelkasten.
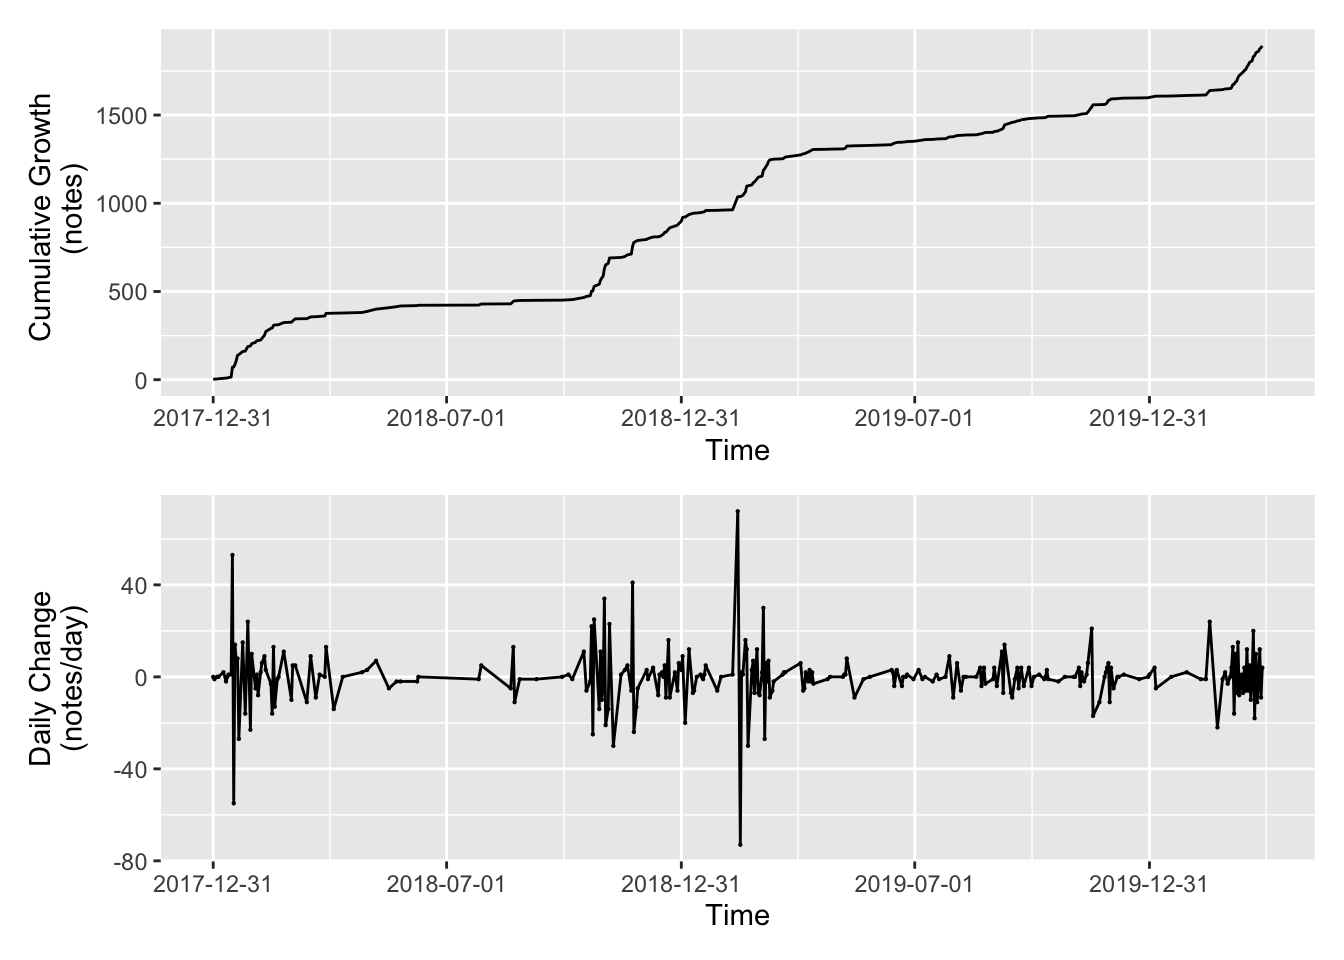
And then the accumulated time series:
Again, it is pretty clear when I started using the ZK. I note that my notes per day seems quite consistent since the slope is pretty linear. A quick fit:
It seems to tick in at 5.6 notes per day for the past few months. How does it look for day of week and time of day:
I guess I collect a lot of notes during the weekend which I then process during Monday and Tuesday. Thursday is usually my meeting and implementation day, so I don't really do a lot of reading and processing.
This looks fairly reasonable. I usually read from 12 to 14 and then process a lot of notes.
@henrikenggaard Very nice! Thanks for sharing. Did you use a similar approach to extract titles from the files in your ZK?
@achamess Almost. I don't have the date-time in the titles of my notes, but they are in some of the metadata stored in my notes.
The processing was done in Mathematica, but any programming language can do this.
I've thought about analyzing connections between notes. I already have some facilities for it (a plug-in for TiddlyWiki):
This is the graph of notes up to and including 3 steps from the current note in my view. The "hub" in the middle is the paper I am currently working on.
But honestly, I don't really know what I'd do with the analysis
That's my gut feeling as well. I think it's fun to see a visualization change over time, e.g. with my David Epstein notes; but I wouldn't know what to do with it, really. I did find the shape of the Epstein notes odd at one point and figured that I wanted to change the graph layout. Some kind of "refactoring". But I cannot imagine doing this all the time.
Author at Zettelkasten.de • https://christiantietze.de/