Views of a ZK

I've come to like different views of my ZK. With digital tools there is more than a list of zettels to a ZK.
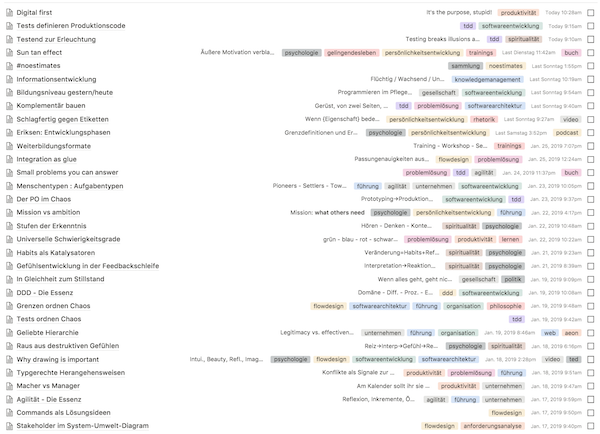
This is a useful view, of course. But it's not my default view. I don't find plain list of titles very inspiring. It does not draw me into my ZK to work with it.
Rather, I switch between different views to jog my memory and to use my zettels like lego blogs to build thoughts, theories, concepts, texts from.
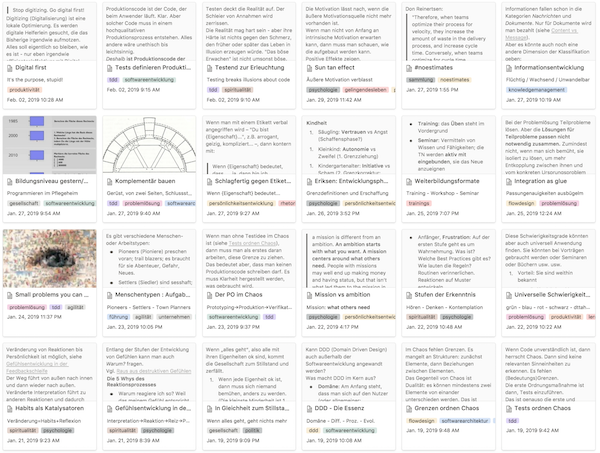
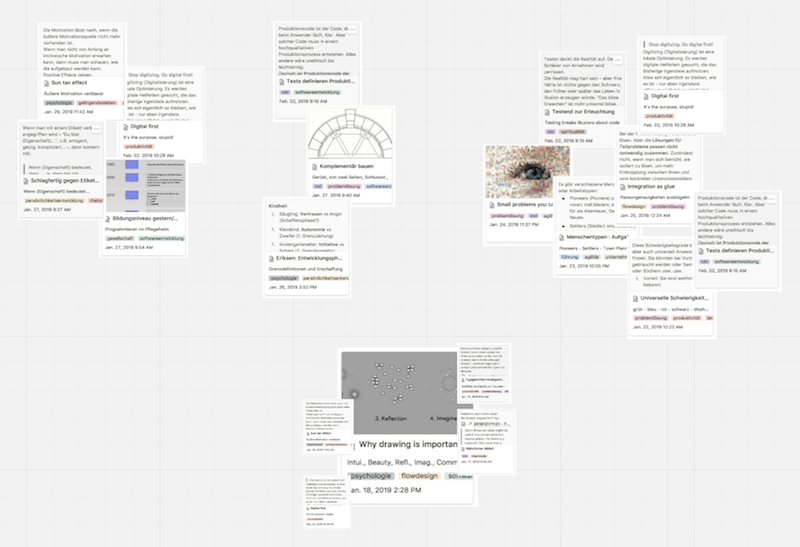
A card view lets me browse my ZK with more information at a glance. Images stick out and trigger memories. I can rearrange zettels to form clusters.
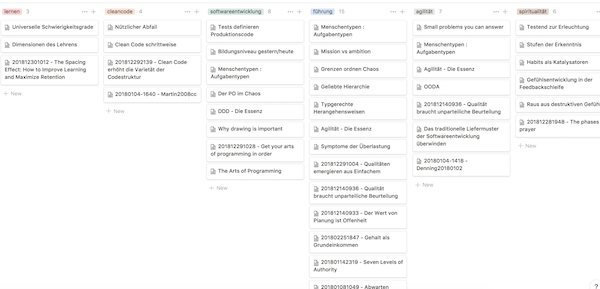
Or I look at zettels through a tag lens. That helps clustering, too. And it gives me a topical overview.
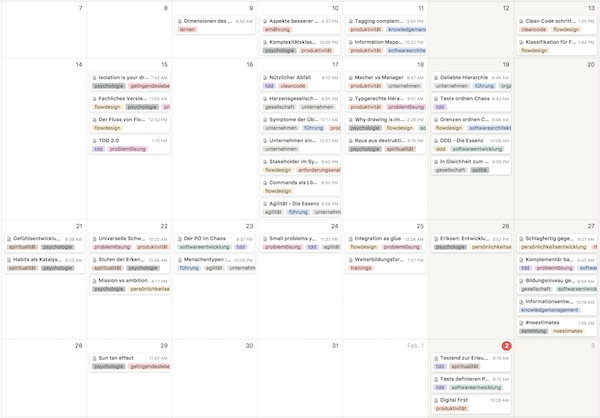
Or, for a moment, I enjoy a calendar view of my ZK to see how productive I have been. When were the days of many ideas, when was I slow at coming up with new ones? What's the flow of my "zettel production"? Any patterns?
Digital tools can and should help us to go beyond what the father of the ZK was able to do. And these views are just the tip of the iceberg of what's possible.
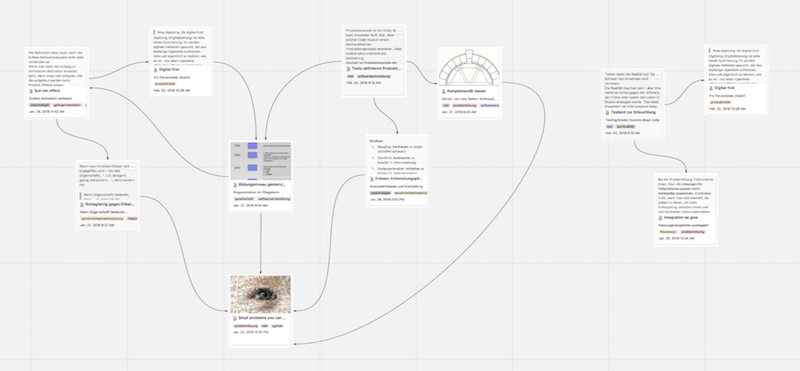
Why not arrange zettels spatially, for example?
Or show their connectedness?
Their are tools for all that - but, alas, so far not all of these views have come together in a single ZK tools. I'm optimistic, though, that this can and will improve. We should stop digitizing notes, and start going digital first with our ZKs.
Howdy, Stranger!
Comments
This looks great! I'm also searching for an easy way to be more visually/spatially freeform with a subset of a zettelkasten. Trying a bit with importing/exporting to mindmaps or index card style interfaces (for example in Manuskript).
I take it that the first images are from notion.so, but are the last two just mockups?
Yes, notion.so. Yes, the last two are mockups :-) But I suggested the "mural" so notion.so - and they liked it.
@ralfw Thank you so much for sharing how you use digital tools to view your ZK.
I have struggled with trying to use digital tools myself. A text-based only tool was not working with my process of thinking and discovery. I have to see visually the content in my zettels to discover linkages with and development of thoughts, theories, concepts and so on. I have been digitalizing notes, instead of "going digital first".
When I reflect on why I think this way, a few things come to mind;
Work in Japanese
I work in a language which is very visual. Japanese (probably the same with Chinese) contains kanji (Chinese characters) which look like little "pictures" for words. When I come across a new word, I can often times work out what it means by just looking at the "picture".
Use of Diagrams in Japanese Management Studies
Many scholars of Management Studies in Japan make use of diagrams to explain concepts. This is true of Management Studies elsewhere to a certain degree, but Japanese text is full of diagrams! I find that I struggle to understand a text in English when it does not have a diagram to explain a difficult concept, thought and so on. The diagrams are somewhat similar to Rich Pictures used in Soft Systems Methodology. https://en.wikipedia.org/wiki/Rich_picture
Use of Grounded Theory
I use Grounded Theory methodology as a guide in my research. I find that the use of Grounded Theory and ZK follows some parallels in discovery of insights through patterns in "data". http://www.groundedtheory.com/what-is-gt.aspx
Stroke
I had a stroke 3 years ago which made it difficult to absorb what a whole lot of text was saying. I have to translate text into visual diagrams to understand it properly. But far from being a stroke of bad luck (no pun intended), using diagrams has opened my mind to new connections I had never considered before!
So, @ralfw "seeing" how you use digital software "visually" has opened my world to a deeper understanding of the power of ZK. I hope that you share more!")
Glad, you found my "reports from the land of rich media zettels" helpful ;-)
In your area of research it's obvious that zettels consisting just of text don't cut it. Only a tool which makes it easy to mix text and graphics is going to be helpful.
But I think media in general and visualizations in particular are underrated in creating zettels. Likewise rich structuring of data through tables, columns, nesting is underrated.
The sketchnote "movement" or books like Dan Roam's "The back of the napkin" clearly show how human "information processing" can benefit from visualization. To abandon that when creating zettels to me seems quite artificial.
Tools should bend to human nature and needs, not the other way round.