Share with us what is happening in your ZK this week. February 9, 2024

Swimming with Ideas
This is another installment of the What Are You Working On? thread. Add to this discussion by telling us about your zettelkasten journey. Share with us what you're learning. Sharing helps me and, hopefully, you, too. It helps me clarify my goals and visualize my thinking. And sometimes, a conversation sparks a magical moment where we can dive into an idea worth exploring. We'd love to hear more from you. 🫵🏼
Ideas I'm exploring with my ZK:
- I am exploring the idea of when my body is in motion and when it is at rest, it interacts with inertia.
- How do I modify the format of my wikilinks to something more generic? I feel for @ZettelDistraction's pain, and he modified his file names and the links in his ZK. Just the thought of attempting this hurts my little brain.
- I'm thinking about adulting my Monk Mornings.
- I use my ZK in support of my university literature and writing coursework.
Things I'm reading:
- Quintero, Isabel. Gabi, a girl in pieces. 2014.
- Picard, Max. The world of silence. 1948.
- Gardner, Dwight. UPSTAIRS DELICATESSEN: on eating, reading, reading about eating, and eating while reading. 2024.
- Yoon, Nicola. The sun is also a star. 2016.
Music I'm listening to:
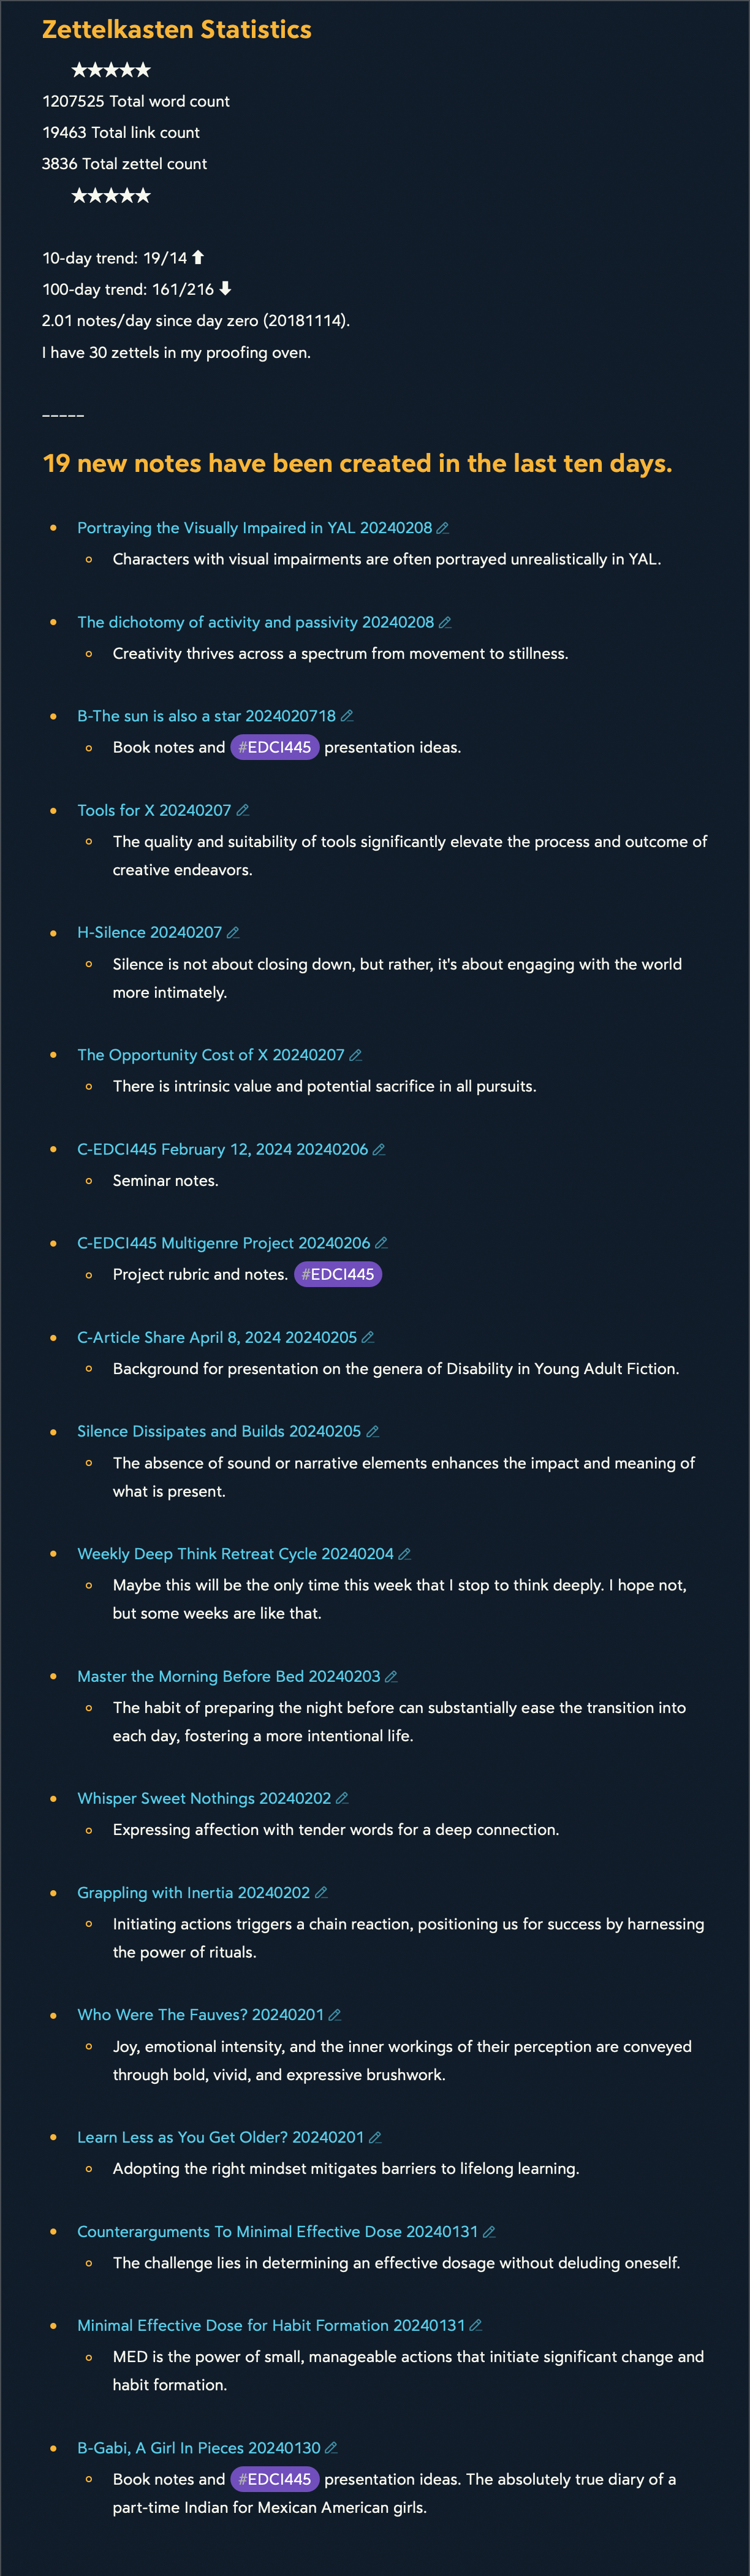
A look at my ZK work themes:
1/19 zettel - meta zettelkasting
3/19 zettel - meta writing
0/19 zettel - advancing python
6/19 zettel - Ed-Curriculum & Instruction (EDCI445)
9/19 zettel - captured new and novel ideas
★★★★★
The "My rolling ten-day zettel production" is produced by a script for attachment to my daily journaling template. I do my journaling in Bear to keep personal journaling separate from my knowledge work.
Let me know if you would like to discuss any of these notes.
My ten day zettel production
Will Simpson
My peak cognition is behind me. One day soon, I will read my last book, write my last note, eat my last meal, and kiss my sweetie for the last time.
My Internet Home — My Now Page
Howdy, Stranger!
Comments
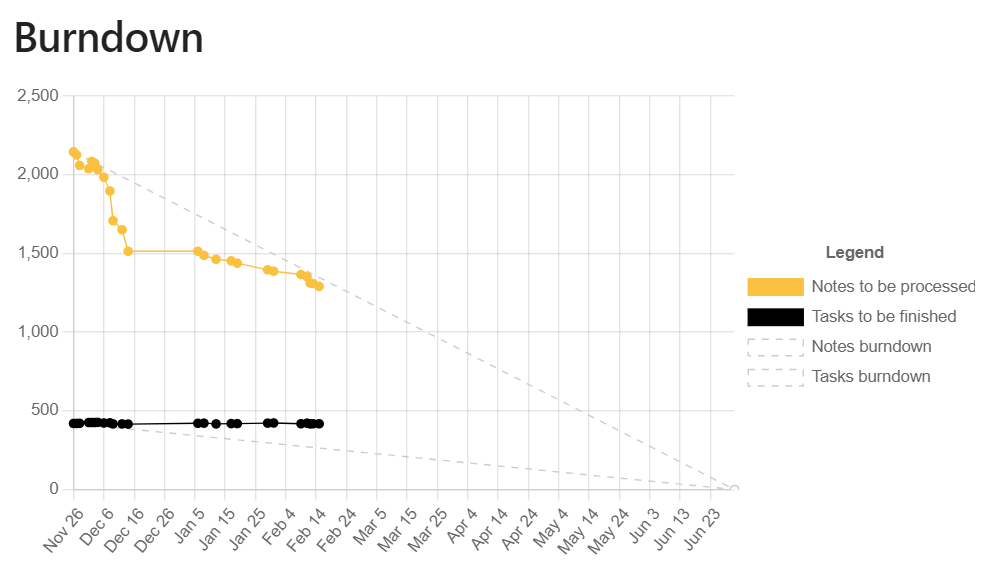
This week: a fix to the Zettel validation statistics code in https://github.com/flengyel/Zettel, which contains a Zettel template and a Zettel Wiki for a software implementation of the Zettelkasten method. I have several Zettels to clean up.
Now that the code is fixed, after languishing for a month, in addition to a helpful list of Zettels with formatting errors, the code produces a pie chart and a histogram in the spirit of the reports of little or no value that middle managers notoriously demand from their overworked staff.
More helpful is the output of Zettels with formatting errors. By popular demand, here is a sample from the output:
Another project: rewriting the REYAX RYLR998-LoRa module code using the Kivy API in collaboration with ChatGPT4. ChatGPT4 isn't the sharpest coding partner--it makes mistakes and forgets our progress. Against that, ChatGPT's lapses force me to review the code and introduce an element of desirable difficulty.
I have been writing trivial mathematics exercises in my Zettelkasten. It could be worse--I could be playing Solitaire online. Working on easy exercises is like playing chess against the weakest player. I need to revisit a project in simplicial homotopy theory, but it may have to wait for retirement. I plan to work on SageMath development at some point.
How to Comment on Social Media by Rebecca Solnit is worth reading.
GitHub. Erdős #2. Problems worthy of attack / prove their worth by hitting back. -- Piet Hein. Alter ego: Erel Dogg (not the first). CC BY-SA 4.0.
Here's the graph of my ZK. It has a very similar shape to yours. I wonder if this is a typical shape for a ZK once it reaches a certain size. I can share the Python code that created this graph so you can try it out and see if your graph is similar to ours. Please post a screenshot of you graph. We'd love to see it.
The Python Code
import os
import matplotlib.pyplot as plt
import numpy as np

def get_word_count(file_path):
    with open(file_path, 'r', encoding='utf-8', errors='ignore') as f:
        return len(f.read().split())

def get_file_paths(directory_path):
    return [os.path.join(directory_path, f) for f in os.listdir(directory_path) if os.path.isfile(os.path.join(directory_path, f))]

directory_path = '/Users/will/Dropbox/zettelkasten'
file_paths = get_file_paths(directory_path)
word_counts = [get_word_count(f) for f in file_paths]

# Define the bins
bins = [0, 20, 40, 60, 80, 100, 250, 500, 750, 1000, np.inf]
# Use numpy's histogram function to divide the data into bins
counts, bins = np.histogram(word_counts, bins=bins)
# Convert the bins to string labels, excluding the last bin
labels = [f'{int(bins[i])+1}-{int(bins[i+1])}' for i in range(len(bins)-2)]

# Handle the last label separately
labels.append(f'{int(bins[-2])}+')

# Convert the histogram data to a bar graph
plt.bar(labels, counts, color='#82D6F0', edgecolor="black", zorder=2)  # Light blue color


# Set the labels for the x-axis and y-axis
plt.xlabel('Word Count Bins')
plt.ylabel('Number of Zettels')
plt.title('Word Count Frequency by Zettel')

# Add a grid
plt.grid(True, which='both', color='grey', linewidth=0.5, linestyle='--')
# Tilt the labels on the x-axis
plt.xticks(rotation=45)

# Show the plot
plt.show()
Will Simpson
My peak cognition is behind me. One day soon, I will read my last book, write my last note, eat my last meal, and kiss my sweetie for the last time.
My Internet Home — My Now Page
Thanks for sharing the script! Tried that on mine
The lower end is inflated due to 1250 notes for Bible chapters where the template starts with about 17 "words".
Author at Zettelkasten.de • https://christiantietze.de/
With Obsidian I'm using a similar type of chart:
I still have some notes with more than 500 words, one note with 3,605. But most of them are below 150 words.
My comment on your charts above: You are using a chart with different bin sizes. To compare your word counts in a bar chart, it's important that they are a consistent size. Otherwise, the height of your bars depends on two variables: the bin size and the word count. Does it make sense?
Edmund Gröpl — 100% organic thinking. Less than 5% AI-generated ideas.
My number of "Good Notes" is growing, but there are still many notes to inspect and adapt.
Edmund Gröpl — 100% organic thinking. Less than 5% AI-generated ideas.
This is how it looks in my Zettelkasten.
Similar to @ctietze, the note count on the small end is artificially increased because of the 1250 empty bible chapters.
I am a Zettler
I forgot to give the URL to the source code for my graph, though your version is more directly helpful to others: https://github.com/flengyel/Zettel/blob/main/zk_validation_stats.py.
Over a small sample of Zettelkasten with hundreds to thousands of notes, there is a dominant bin of 101-250 words. That's interesting. Perhaps we could say that an atomic Zettel, which for me means a Zettel with a single focus, typically has between 100 and 250 words.
@Edmund The number of bins, the bin sizes, and the bin ranges of the histograms are identical. The height of each bin depends on the number of Zettels whose word count lies in the bin. One could normalize by the total number of Zettels to get probabilities. Scaling will change the area under the histogram by the scaling factor, but the bin of maximum height is scale-invariant, for example.
GitHub. Erdős #2. Problems worthy of attack / prove their worth by hitting back. -- Piet Hein. Alter ego: Erel Dogg (not the first). CC BY-SA 4.0.
Mmh?! - An example: Let us start in Sascha's chart with one bar with word count from 1-100. The first bar would have a height of about 7,500 Zettels. The second from 101-200 less than 4,000. There is no visible growth. The bars are getting smaller and smaller from left to right. That's what I mean.
Edmund Gröpl — 100% organic thinking. Less than 5% AI-generated ideas.
@Edmund: The bins of each of the graphs are identical, and they are 1-20,21-40,41-60, 61-80, 80-100, 101-250, 251-500,501-750, 751-1000, 1000+. Do you mean that the widths of the bins vary? They vary. However, they are consistent for all of the graphs.
I'll change to equal-width bins.
So? Why should there be? These are frequency histograms, not cumulative distributions.
GitHub. Erdős #2. Problems worthy of attack / prove their worth by hitting back. -- Piet Hein. Alter ego: Erel Dogg (not the first). CC BY-SA 4.0.
In this example, the bins have equal width.
The median Zettel is 174 words. The median is more useful than the average here, since the distribution isn't normal.
Total number of words: 257098
Average number of words per Zettel: 340.5271523178808
Minimum number of words in a Zettel: 4
Maximum number of words in a Zettel: 12374
Most common word count: (99, 9)
Least common word count: (255, 1)
Median word count: 174
Here is code for the median.
def median_word_count(word_counts): """Calculate the median word count from a list of word counts""" sorted_word_counts = sorted(word_counts) length = len(sorted_word_counts) if length % 2 == 0: return (sorted_word_counts[length // 2 - 1] + sorted_word_counts[length // 2]) / 2 else: return sorted_word_counts[length // 2]GitHub. Erdős #2. Problems worthy of attack / prove their worth by hitting back. -- Piet Hein. Alter ego: Erel Dogg (not the first). CC BY-SA 4.0.
Here is a hybrid approach that combines fine-grained bins for lower word counts with broader bins as the word counts increase, leading to a non-linear distribution that emphasizes detail in lower ranges and aggregates higher ranges more coarsely. There is nothing wrong with doing this. This configuration is common in data visualization where the scale's granularity is adjusted to reflect the density and importance of data across different ranges.
GitHub. Erdős #2. Problems worthy of attack / prove their worth by hitting back. -- Piet Hein. Alter ego: Erel Dogg (not the first). CC BY-SA 4.0.
... There is nothing wrong with doing this.
Yes, I agree. And thank you for preparing these different chart styles. Yes, there is nothing wrong with the calculation.
My view: It’s a question of visual habits. A large bar in a chart always grabs visual attention. Reading the numbers at the x-axis is mostly the second step. For me it’s like using charts with suppressed zero values. For brains with linear thinking, I would expect charts with linear grids.
But it’s my personal view, maybe strongly influenced by my profession.
Edmund Gröpl — 100% organic thinking. Less than 5% AI-generated ideas.
Just another version, but the same data. I've changed the step-chart to a bar-chart and added the median word count as a good recommendation from @ZettelDistraction.
Comparing median word counts:
174 - @ZettelDistraction
96 - @Edmund
What makes the difference? May be my selction: I've filtered "Permanent Notes" only, no "Structure Notes", no "Reference Notes" and no "Project Notes".
Edmund Gröpl — 100% organic thinking. Less than 5% AI-generated ideas.
For those of us who are playing along with this thread, here are my comparisons.
I'm surprised by how smooth the curve is with equal-width bins. @ZettelDistraction and I have a peak in the 51-100 bin. I didn't think I had so many zettel in this range. With the hybrid approach we can see the distribution of the smaller zettel in comparison with the larger zettel.
Comparing median word counts:
174 - @ZettelDistraction
96 - @Edmund
196 - @Will
Bins of equal width
The Python Code
import os
import matplotlib.pyplot as plt
import numpy as np

def get_word_count(file_path):
    with open(file_path, 'r', encoding='utf-8', errors='ignore') as f:
        return len(f.read().split())

def get_file_paths(directory_path):
    return [os.path.join(directory_path, f) for f in os.listdir(directory_path) if os.path.isfile(os.path.join(directory_path, f))]

def median_word_count(word_counts):
    """Calculate the median word count from a list of word counts"""
    sorted_word_counts = sorted(word_counts)
    length = len(sorted_word_counts)
    if length % 2 == 0:
        return (sorted_word_counts[length // 2 - 1] + sorted_word_counts[length // 2]) / 2
    else:
        return sorted_word_counts[length // 2]

directory_path = '/Users/will/Dropbox/zettelkasten'
file_paths = get_file_paths(directory_path)
word_counts = [get_word_count(f) for f in file_paths]
median = median_word_count(word_counts)

# Define the bins
bins = [0, 50, 100, 150, 200, 250, 300, 350, 400, 450, 500, 550, 600, 650, 700, 750, 800, 850, 900, 950, 1000, np.inf]
# Use numpy's histogram function to divide the data into bins
counts, bins = np.histogram(word_counts, bins=bins)
# Convert the bins to string labels, excluding the last bin
labels = [f'{int(bins[i])+1}-{int(bins[i+1])}' for i in range(len(bins)-2)]

# Handle the last label separately
labels.append(f'{int(bins[-2])}+')

# Convert the histogram data to a bar graph
plt.bar(labels, counts, color='#82D6F0', edgecolor="black", zorder=2)  # Light blue color

# Set the labels for the x-axis and y-axis
plt.xlabel('Word Count Bins')
plt.ylabel('Number of Zettels')
plt.title(f'Word Count Frequency by Zettel\n Median WC {median} Words')  # Fix the title string formatting

# Add a grid
plt.grid(True, which='both', color='grey', linewidth=0.5, linestyle='--')
# Tilt the labels on the x-axis
plt.xticks(rotation=45)

# Show the plot
plt.show()
The Hybrid Approach
The Python Code
import os import matplotlib.pyplot as plt import numpy as np def get_word_count(file_path): with open(file_path, 'r', encoding='utf-8', errors='ignore') as f: return len(f.read().split()) def get_file_paths(directory_path): return [os.path.join(directory_path, f) for f in os.listdir(directory_path) if os.path.isfile(os.path.join(directory_path, f))] def median_word_count(word_counts): """Calculate the median word count from a list of word counts""" sorted_word_counts = sorted(word_counts) length = len(sorted_word_counts) if length % 2 == 0: return (sorted_word_counts[length // 2 - 1] + sorted_word_counts[length // 2]) / 2 else: return sorted_word_counts[length // 2] directory_path = '/Users/will/Dropbox/zettelkasten' file_paths = get_file_paths(directory_path) word_counts = [get_word_count(f) for f in file_paths] median = median_word_count(word_counts) # Define the bins bins = [0, 20, 40, 60, 80, 100, 125, 150, 175, 200, 250, 300, 400, 500, 600, 700, 800, 900, 1000, np.inf] # Use numpy's histogram function to divide the data into bins counts, bins = np.histogram(word_counts, bins=bins) # Convert the bins to string labels, excluding the last bin labels = [f'{int(bins[i])+1}-{int(bins[i+1])}' for i in range(len(bins)-2)] # Handle the last label separately labels.append(f'{int(bins[-2])}+') # Convert the histogram data to a bar graph plt.bar(labels, counts, color='#82D6F0', edgecolor="black", zorder=2) # Light blue color # Set the labels for the x-axis and y-axis plt.xlabel('Word Count Bins') plt.ylabel('Number of Zettels') plt.title(f'Word Count Frequency by Zettel\n Median WC {median} Words') # Fix the title string formatting # Add a grid plt.grid(True, which='both', color='grey', linewidth=0.5, linestyle='--') # Tilt the labels on the x-axis plt.xticks(rotation=45) # Show the plot plt.show()Will Simpson
My peak cognition is behind me. One day soon, I will read my last book, write my last note, eat my last meal, and kiss my sweetie for the last time.
My Internet Home — My Now Page
Why filter your notes? I don't. A note is a note is a note.
Will Simpson
My peak cognition is behind me. One day soon, I will read my last book, write my last note, eat my last meal, and kiss my sweetie for the last time.
My Internet Home — My Now Page
So true :-)
We already started this discussion some "weeks" ago. And there is always a second view on the same subject. As I've said, I use different types of notes to support my process.
Edmund Gröpl — 100% organic thinking. Less than 5% AI-generated ideas.
Many notes => smooth curve
Equal-width bins are showing the "magic" behind the numbers.
Edmund Gröpl — 100% organic thinking. Less than 5% AI-generated ideas.
Thank you for generating the graphs. I will stick with the linear scale histogram since this is the easiest to read.
WARNING: feature request. Suppose The Archive made word count histograms a feature, with the option to upload the graphs to @ctietze's phone. (@Sascha's phone too.) This thread has a small sample size, but a built-in feature might provide enough data to make reasonable inferences about Zettelkastens. A random Zettel's median and average word count is a worthwhile statistic, especially for someone new to Zettelkasten who wants an idea of the length of a typical note. We have to add connectivity statistics. I'll get to this.
I keep research notes for projects in my Zettelkasten rather than keep them elsewhere. Before a LiteVNA 64 vector network analyzer from AliExpress arrived in the mail yesterday, there were five projects--now there are six. (I wanted to measure the SWR of specific unconventional antennas.) Aside from projects that feed back into my Zettelkasten, there are a few irresistible activities, such as defining portmanteau words.
Here are some abbreviated definitions.
Trashionale (noun) /traʃ-ɪ-ˈnæl/
Another one is "copromise," a portmanteau of "compromise" and "copro-" (a prefix derived from the Greek word for feces, "kopros").
Copromise (noun) /ˈkoʊ-prə-maɪz/
I thought of the portmanteau word "jestation," but someone else earlier independently gave it a completely different meaning. Here's mine.
Jestate (verb) /ˈdʒɛs-teɪt/
Jestation (noun) /ˈdʒɛs-teɪʃən/
NOTE: there is a reference to "Jestation" with an entirely different meaning at Verboticism: Jestation (verbotomy.com)
Aside from this, a mathematics project I started in 2021 was led astray by Bard and now Gemini, who hallucinated bogus references to a non-existent theorem by an author who published no such theorem. Bard then claimed two mathematicians who never worked together published a generalization. A computational experiment showed that the theorem wasn't just false but very false. When I failed to find any reference to the work the AI assistant cited, I was led to related papers I could reference, which can be reinterpreted in a new formalism.
GitHub. Erdős #2. Problems worthy of attack / prove their worth by hitting back. -- Piet Hein. Alter ego: Erel Dogg (not the first). CC BY-SA 4.0.
Thanks for updating the scripts!
I subtracted 1250 of the template notes in the 0--50 bin:
@ZettelDistraction I'm looking at ways to make this possible with the plugin engine for The Archive. Producing images isn't on the list of the initial capabilities, so maybe we'll get a table first, but I agree that the stats are interesting to share and compare!
Who knows, next year we may have enough data to feed an empirical B.A. thesis")
Author at Zettelkasten.de • https://christiantietze.de/
Interesting:
It seems that I have more short notes than both @Will and @ZettelDistraction, relatively speaking.
I am a Zettler
Comparing median word counts:
196 - @Will
174 - @ZettelDistraction
96 - @Edmund
93 - @ctietze
86 - @Sascha
It reminds me at a quote from my ZK:
My first questions:
What are your personal questions?
Edmund Gröpl — 100% organic thinking. Less than 5% AI-generated ideas.
That's a great idea. Going to try this in a Zettelkasten Janitor later
Author at Zettelkasten.de • https://christiantietze.de/
@ctietze I'm tempted to spring for a Mac to join the plugin fun (not to mention the experience of working in The Archive). If I were more serious about statistics, I would switch to the R-project. A table export would be more helpful for statistical analysis than a histogram image, though an image will save most people time and effort.
I ran my code through the Python optimizer GPT at openai.org. This has helped improve the code readability and logic. I've learned more in minutes and hours from AI assistants than I have over years from humans--including myself, sadly.
The appearance of my word frequency histogram has changed.
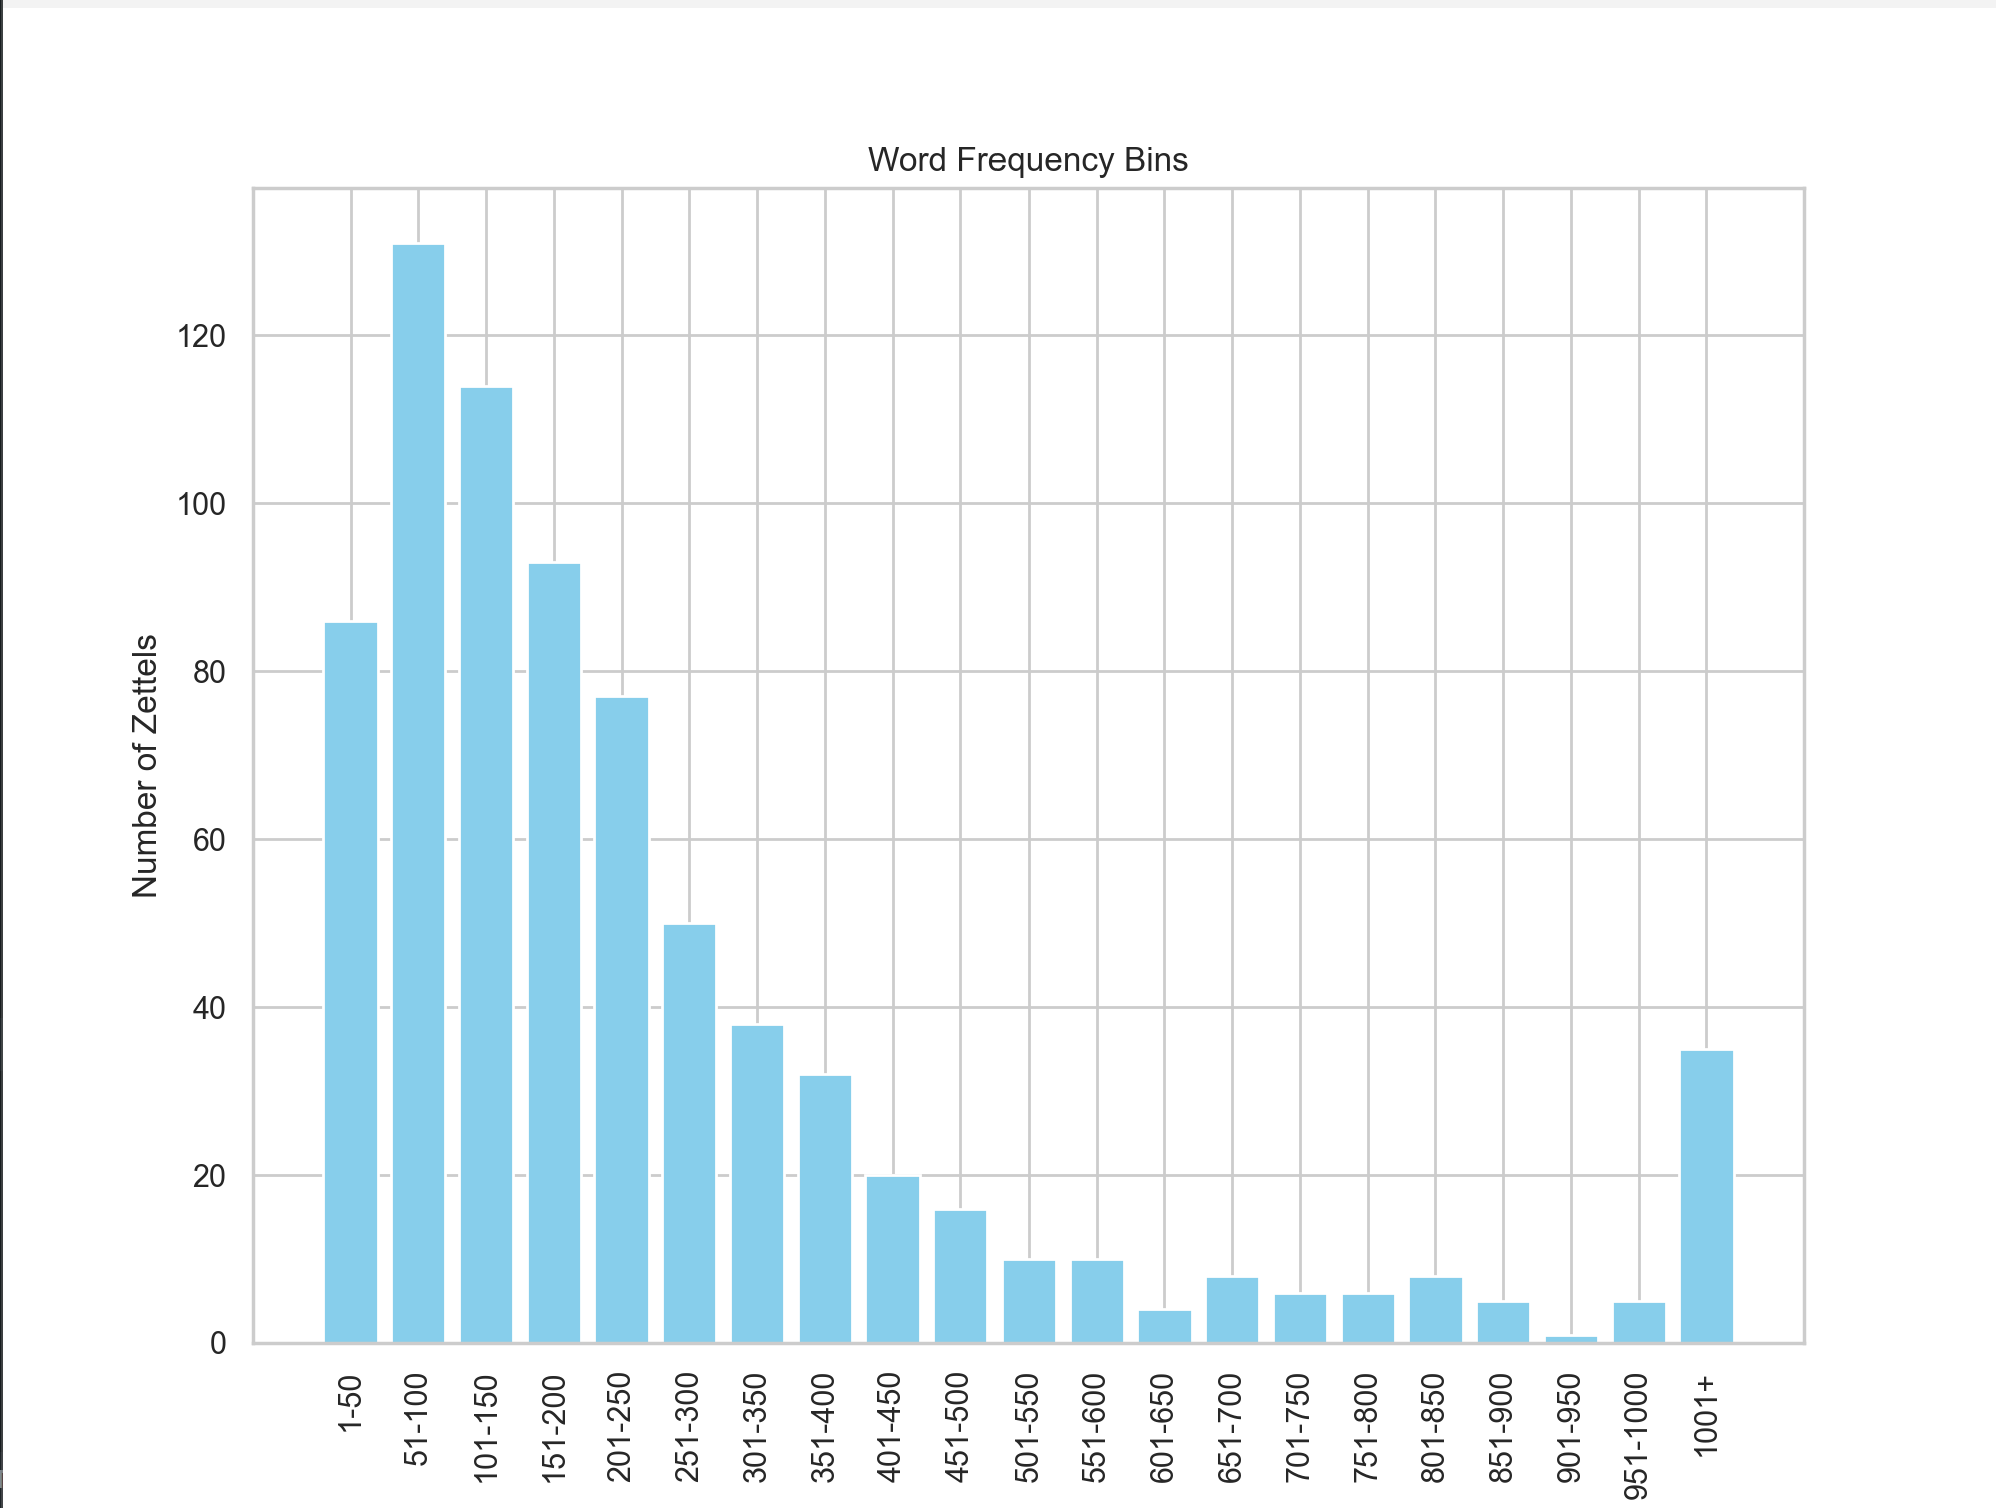
This distribution is what you'd expect from a collection of notes. It's hard to say if the histogram says something different about Zettelkasten since we haven't compared collections of notes with notes in a Zettelkasten. The histogram doesn't give us network statistics. A table export is more helpful than an image for ease of statistical analysis.
@Edmund, my question is, "What on Earth am I doing?" A presentation on one of the Link Your Thinking videos mentioned that a Zettel should have a single focus. That, to me, is more informative than the adjective "atomic." In my view, an atomic Zettel should be around the size of an electron, which is sub-atomic. The intention is that Zettels should be self-contained, but if this is the case, why connect them? They're self-contained. Perhaps I am being unreasonable. I'm still fixing Zettel formats.
GitHub. Erdős #2. Problems worthy of attack / prove their worth by hitting back. -- Piet Hein. Alter ego: Erel Dogg (not the first). CC BY-SA 4.0.
196 - @Will
174 - @ZettelDistraction
96 - @Edmund
93 - @ctietze
86 - @Sascha
This time, it is a bit embarrassing to be at the top of the list. I'm a bit wordy. Partly, the reason for the higher median word count is the higher number of notes in the 1000+ bin. Partly, I use YAML in a template for every note. The templates have around 50 words as YAML and prompts. The prompts get edited as the note proofs.
@Sascha wins!
Will Simpson
My peak cognition is behind me. One day soon, I will read my last book, write my last note, eat my last meal, and kiss my sweetie for the last time.
My Internet Home — My Now Page
Yes, that's what I mean. :-)
More about: https://zettelkasten.de/posts/create-zettel-from-reading-notes/
Edmund Gröpl — 100% organic thinking. Less than 5% AI-generated ideas.
So, I'm not alone with this task:
Edmund Gröpl — 100% organic thinking. Less than 5% AI-generated ideas.
Not at all. I found, to my horror, that a backup attempt that went awry left a copy of the Zettelkasten directory under my Zettelkasten directory. I had been editing Zettels in the subdirectory. Not good. I had to sort through these to find the correct versions. That was yesterday.
Also yesterday, an involuntary, elementary mathematical observation occurred to me.
VNA.1a.0.24.0217 Calibration and the Smith Chart
[[VNA.1.0.24.0215]] LiteVNA 64 calibration .
[[LoRa.2a1b.1.0.23.0405]] RFID Antenna
#vector-network-analyzer #litevna64 #rokland
As I was taking an SWR measurement of an RFID circularly-polarized flat-panel antenna with the LiteVNA 64 vector network analyzer, I realized that the calibration steps OPEN, SHORT, and LOAD correspond to the three points that map the complex plane (the reflection plane) onto the unit circle of the Smith chart.
The OPEN calibration step sends $(\infty\Omega)$ to the point $(+1)$ on the unit circle.
The SHORT calibration step sends $(0\Omega)$ to the point $(-1)$ on the unit circle.
The LOAD calibration step sends the "dummy load" $(50\Omega)$ impedance to the center $(0)$ of the unit circle. (Strictly speaking, I haven't measured the resistance of the SMA connector for the LOAD calibration step--I assume that it is $(50\Omega)$.)
This is a linear-fractional (so conformal) transformation of the complex domain to the unit circle of the form
$(\displaystyle
Z \mapsto \frac {Z- 50\Omega}{Z+50\Omega}
)$
Here is a picture of an SWR measurement of a Rokland 6 dBi Low Profile N-Female Omni Outdoor 915 MHz Antenna.
This is superior to the SWR graph of the flat-panel RFMAX RFID antenna.
(Apologies for the fuzziness of the image. I've located and downloaded the recommended NanoVNA software. I might take another measurement with it to obtain a screenshot.)
We don't know if @Edmund, @ctietze, and @Sascha are writing in German. Ein deutsches Wort ist mehr wert als zwei oder mehr englische Wörter. The preceding sentence isn't the best example. Probably they are more efficient. I think we have to learn to live with this. Germany takes education seriously. We Americans believe that bombing other countries is the path to enlightenment. The US blew up Nordstream 2. Why does Biden get to tell Germany where to get its gas? Now the cost of energy in Germany is high, and America is exporting LNG to Germany. Somehow it's lost on Washington that Russian-German relations are more important for Europe than US-Russia relations. We should be grateful we're still allowed on this site. The bombs versus books deal we made with the Devil shows up in these statistics.
Here is a better screen capture of the vector network analyzer. This is a VSWR graph of an RFID flat-panel antenna with circular polarization, measured between 902 MHz and 928 MHz.
GitHub. Erdős #2. Problems worthy of attack / prove their worth by hitting back. -- Piet Hein. Alter ego: Erel Dogg (not the first). CC BY-SA 4.0.
My Zettelkasten is written in english (98,5 %). For measuring the median word count I also focused on my Permanent Notes (single ideas). The word count of Project Notes mostly describing a set of ideas is much higher.
@ZettelDistraction : A good idea to get a basic understanding why our data is different.
Edmund Gröpl — 100% organic thinking. Less than 5% AI-generated ideas.
My header contains just the title and the hashtags. So, I have an unfair advantage.
But I don't see any practical implications yet, because it all depends on the topics covered, the style etc.
An interesting task would be to analyse the various notes in the respective word-number-categories and look for any patterns.
I am a Zettler
Coming relatively late to this discussion thanks to a strange thing yesterday. I was unable to use my Mac, so I turned to my old iPad in a forced quiet time and looked at my ZK with 1Writer. In particular, I was using the list of Tags to look for tags that had only one Zettel or tags with a seemingly excessive number of Zettels. Along the way, I thought of modifying the Alfred workflow (by Sal Perchard) that produces the list tags and the number of Zettels to sort the list.
Now I see here the discussion of the size distribution of Zettels as a good starting point for Zettel maintenance and I wonder, first, which is the currently "best" python script for producing the histogram?
And also, have people looked at the distribution of tags (how many per Zettel, how many Zettels per tag) as an indication of "goodness"?
Thanks