A System for Writing - Literature Mapping

I've had ‘A System for Writing’, the new book by Bob Doto, on my desk since yesterday.
Before I read a new book, I'm interested in how it relates to the books I've read so far. To get an initial overview, I simply create a new Reference Note for the book in my Zettelkasten. It consists of a brief description of the book and a few references to existing notes.
When I quickly look through the bibliography, I find these references. They are links to books that I have already read or to books that are on my reading list. These are simply added to link the Reference Note. The graphical overview is generated automatically by the Zettelkasten tool.
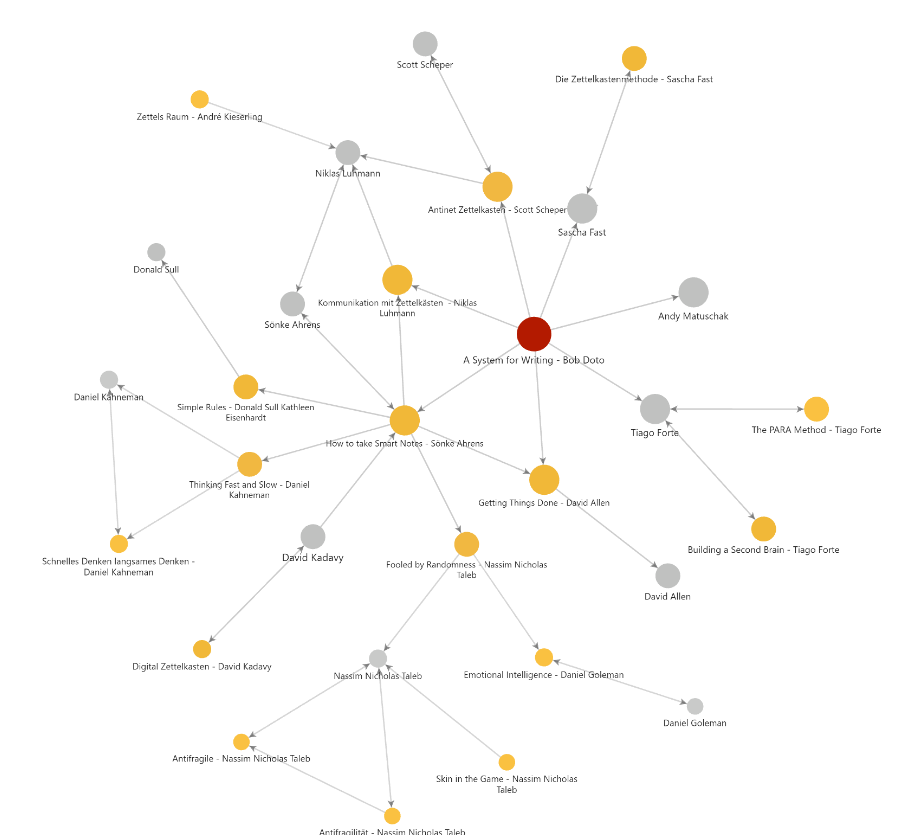
Figure: Local Graph for "A System for Writing - Bob Doto"
The resulting literature map helps to provide an initial overview. By adding a few details, the map becomes somewhat easier to read as a concept map.
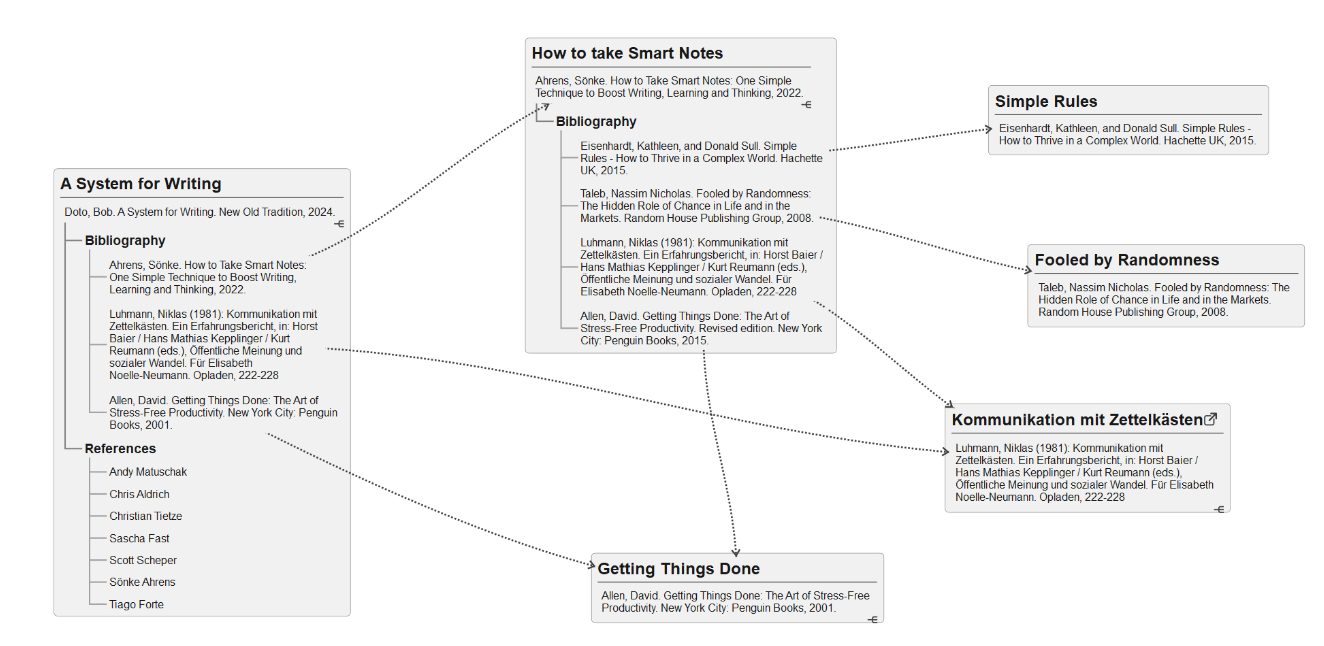
Figure: Concept Map created from bibliographic details
The concept map will be refined further. Quotations and ideas from the existing 'Reference Notes' make the 'Bibliographic Map' easier to read. It now offers a good overview that facilitates the overall understanding of this bibliographic network.
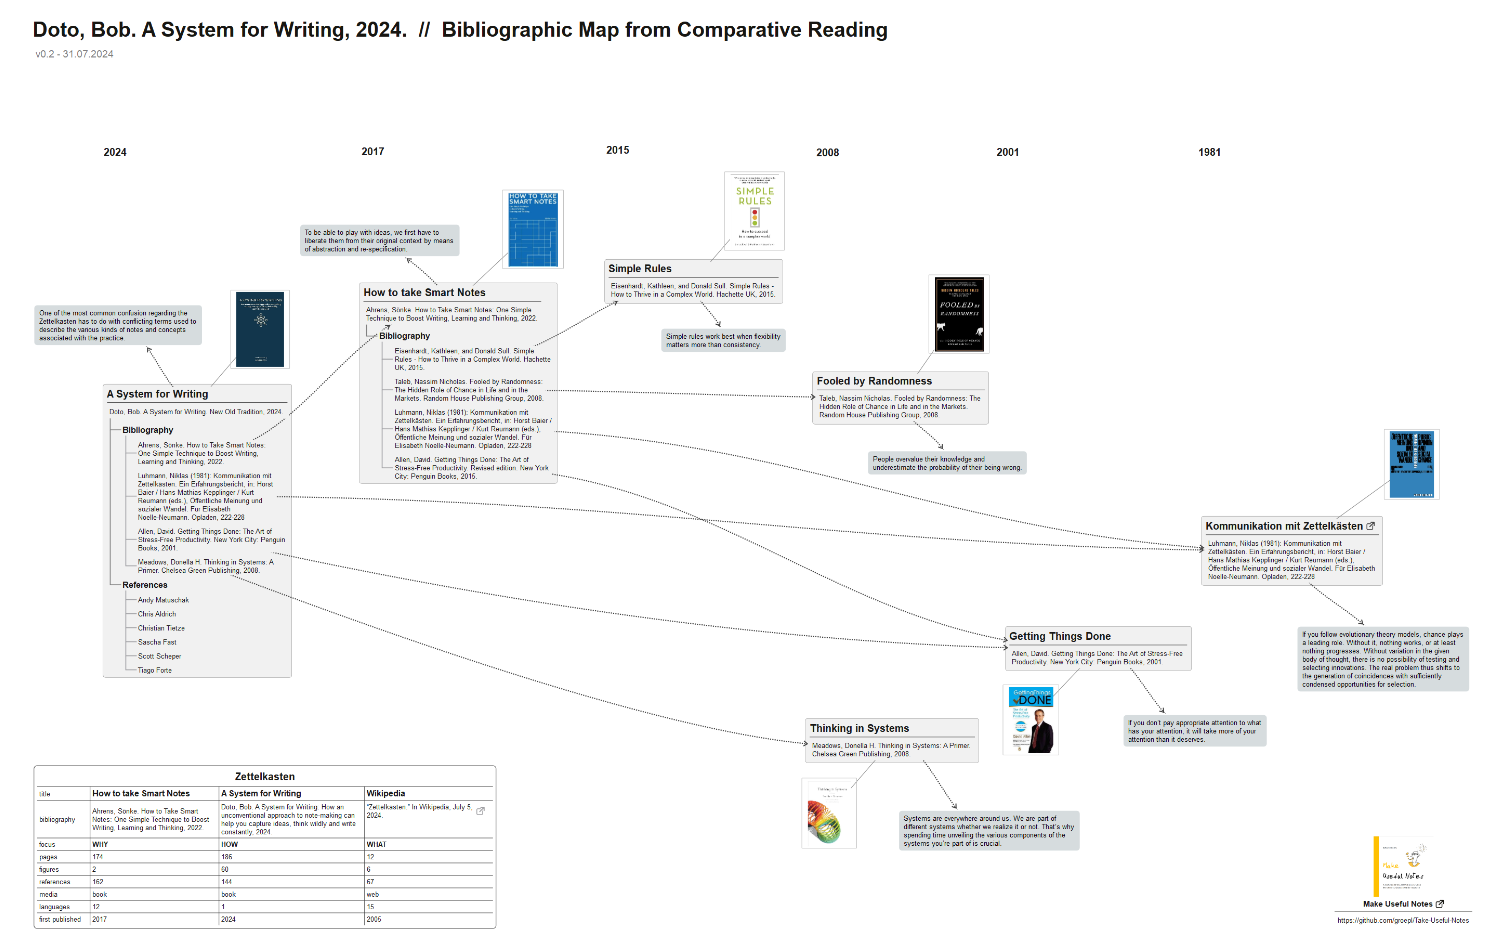
Figure: Extended Concept Map with time axis created from bibliographic details
My learning: The notes in my Zettelkasten benefit from being reduced in size (digital: 500 words or analogue: 5x7" paper size). One note, one idea. But all the connections of my networked notes remain invisible. They are represented by simple hyperlinks on each note. Understanding context means having visibility of these networks. Using Concept Maps with an infinite canvas size is a great help.
Here is another example of extending the "paper size" to create a visual outline: Victor Margolin's zettelkasten process for note taking and writing
Download as PDF: Bibliographic Map · GitHub
More about:
Edmund Gröpl — 100% organic thinking. Less than 5% AI-generated ideas.
Howdy, Stranger!
Comments
Wow! I'm glad I have you as a friend.
This is super interesting. Today, I have become sensitive to the secret nuances of a bibliography. This has been discussed on the forums before, but your graphical images bring home the notion of a hierarchy of books given a research topic. This would be a pyramidal tool for selecting reading material and enriching zettel interconnectivity. You've convinced me to start capturing bibliographies of everything I read that has one. The first step is to capture them; then, I can experiment with putting them to work.
What is this tool you call "the Zettelkasten tool?" These images look like they were created in SimpleMind.
Will Simpson
My peak cognition is behind me. One day soon, I will read my last book, write my last note, eat my last meal, and kiss my sweetie for the last time.
My Internet Home — My Now Page
My friend, thank you for your enthusiastic comment. To share the hidden secrets: I started with Graph View which is an Obsidian plugin. The second my preferred SimpleMind.
And here is a third option:
I’m also fascinated from this concept to work with bibliographies. A book is a network of ideas. A bibliographic map is a network of books of ideas.
Looking forward learning from your results. 😀
Edmund Gröpl — 100% organic thinking. Less than 5% AI-generated ideas.
In chapter 2, on literature reviews, in John W. Creswell's book Research Design: Qualitative, Quantitative, and Mixed Methods Approaches, this is called a literature map.
A literature map like this would be even more useful with typed links: something like, minimally, the "supporting" and "contrasting" types of citations in Scite.ai.
I don't do this in my note system, but it looks like fun and would be important for some kinds of research projects. In my notes, the concept of an argument map or issue map remains central. I don't even have "reference notes" in my note system; instead, I store all that information in the reference manager.
Citation network information can also be stored in the reference manager. The Cita plugin for Zotero tries to do something like this, but I have never used it. I use the reference manager BibDesk, and I sometimes have used the Cites and Cited-by fields in BibDesk to store the citation keys of relevant citations, providing very incomplete citation graph data. But I don't use it much.
In a comment in an adjacent discussion, @zettelsan said:
The Wikipedia article on citation indexes gives a short history of such services. The Institute for Scientific Information (ISI) started publishing important citation indexes in the early 1960s that later became part of Web of Science. (Back around 25 to 30 years ago I was a frequent user of ISI's Arts and Humanities Citation Index via OCLC FirstSearch.) See also Michael Gusenbauer's recent paper, "Beyond Google Scholar, Scopus, and Web of Science: an evaluation of the backward and forward citation coverage of 59 databases' citation indices".
The "Cited by" links in Google Scholar provide citation indexing of a surprisingly large number of academic and non-academic books, and it's free to use. I very often search in Google Scholar for the title of any publication that I'm reading to see if it has forward citations there, and similarly I will search in other full-text search engines too. Don't forget that essentially any search engine provides a kind of quasi-citation index of forward citations when you search for a publication title in quotation marks, because it lists any documents that mention that title.
I wonder how much demand there is for a non-academic citation index? Not much, I imagine. Most non-academic readers, I imagine, are looking for reading suggestions, for which subject indexing and recommender systems are more appropriate.
But back to the subject of citation indexing: professional librarians and providers of library services are often the experts in this area. Librarian @aarontay (who popped into this forum once in "ChatGPT fails for Research") has a great blog, "Aaron Tay's Musings about Librarianship", with relevant posts, mostly on academic research, such as:
Thank you for your hint. Changing the term from “bibliographic map” to “literature map” helped me to find more interesting resources.
Here is another great example:
But I’m still searching for a tool that integrates seamlessly with my Zettelkasten (Obsidian) or my Reference Manager (Zotero).
Edmund Gröpl — 100% organic thinking. Less than 5% AI-generated ideas.
@Edmund said:
This graphic needs some explanation: What do the different node sizes and colors and inter-node spacing represent?
Perhaps we need different terms to differentiate between
When you say you're "searching for a tool that integrates seamlessly", do you imagine that tool to be more like 1 or 2?
It seems that you already have 1 by viewing your reference notes in Obsidian's graph view.
@Andy
There isn't much demand for subject indexing and recommender systems in the non-academic world, but there should be. Subject indexing and recommender systems are third-party sources, whereas citation indexes and bibliographies are direct sources.
One disadvantage of subject indexing and recommender systems is that they are so prolific that one becomes paralyzed by choice. One still needs to curate which subject index and recommender system one uses.
As usual, your tips and pointers are timely. Your tip on using Google Scholar as a reading recommendation engine got me thinking about using Research Rabbit in a similar fashion. I imputed "The Housekeeper and the Professor" and got 10 authors and 34 related papers. Only a few had interconnections and no books, only interesting and relevant papers. This is an interesting idea to explore. Again, not with every note, only those radioactive with the music of the celestial spheres.
Will Simpson
My peak cognition is behind me. One day soon, I will read my last book, write my last note, eat my last meal, and kiss my sweetie for the last time.
My Internet Home — My Now Page
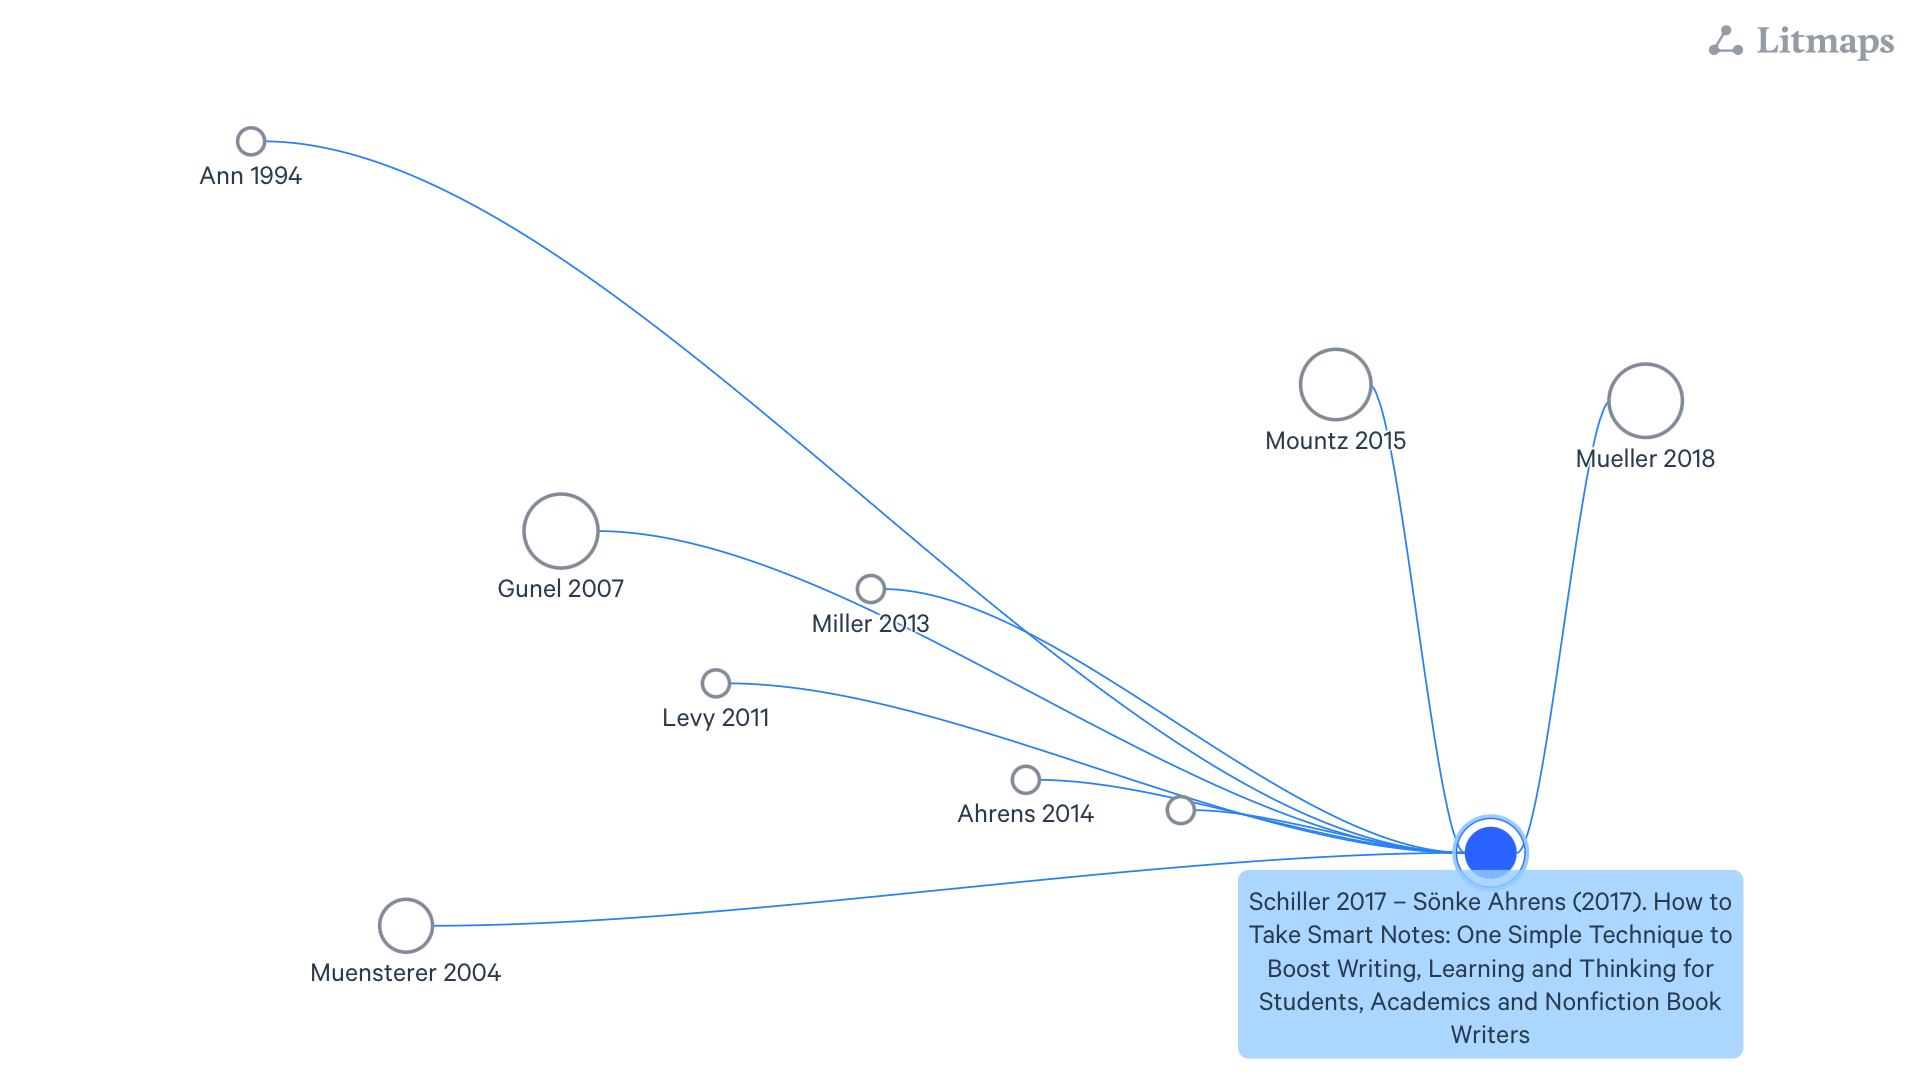
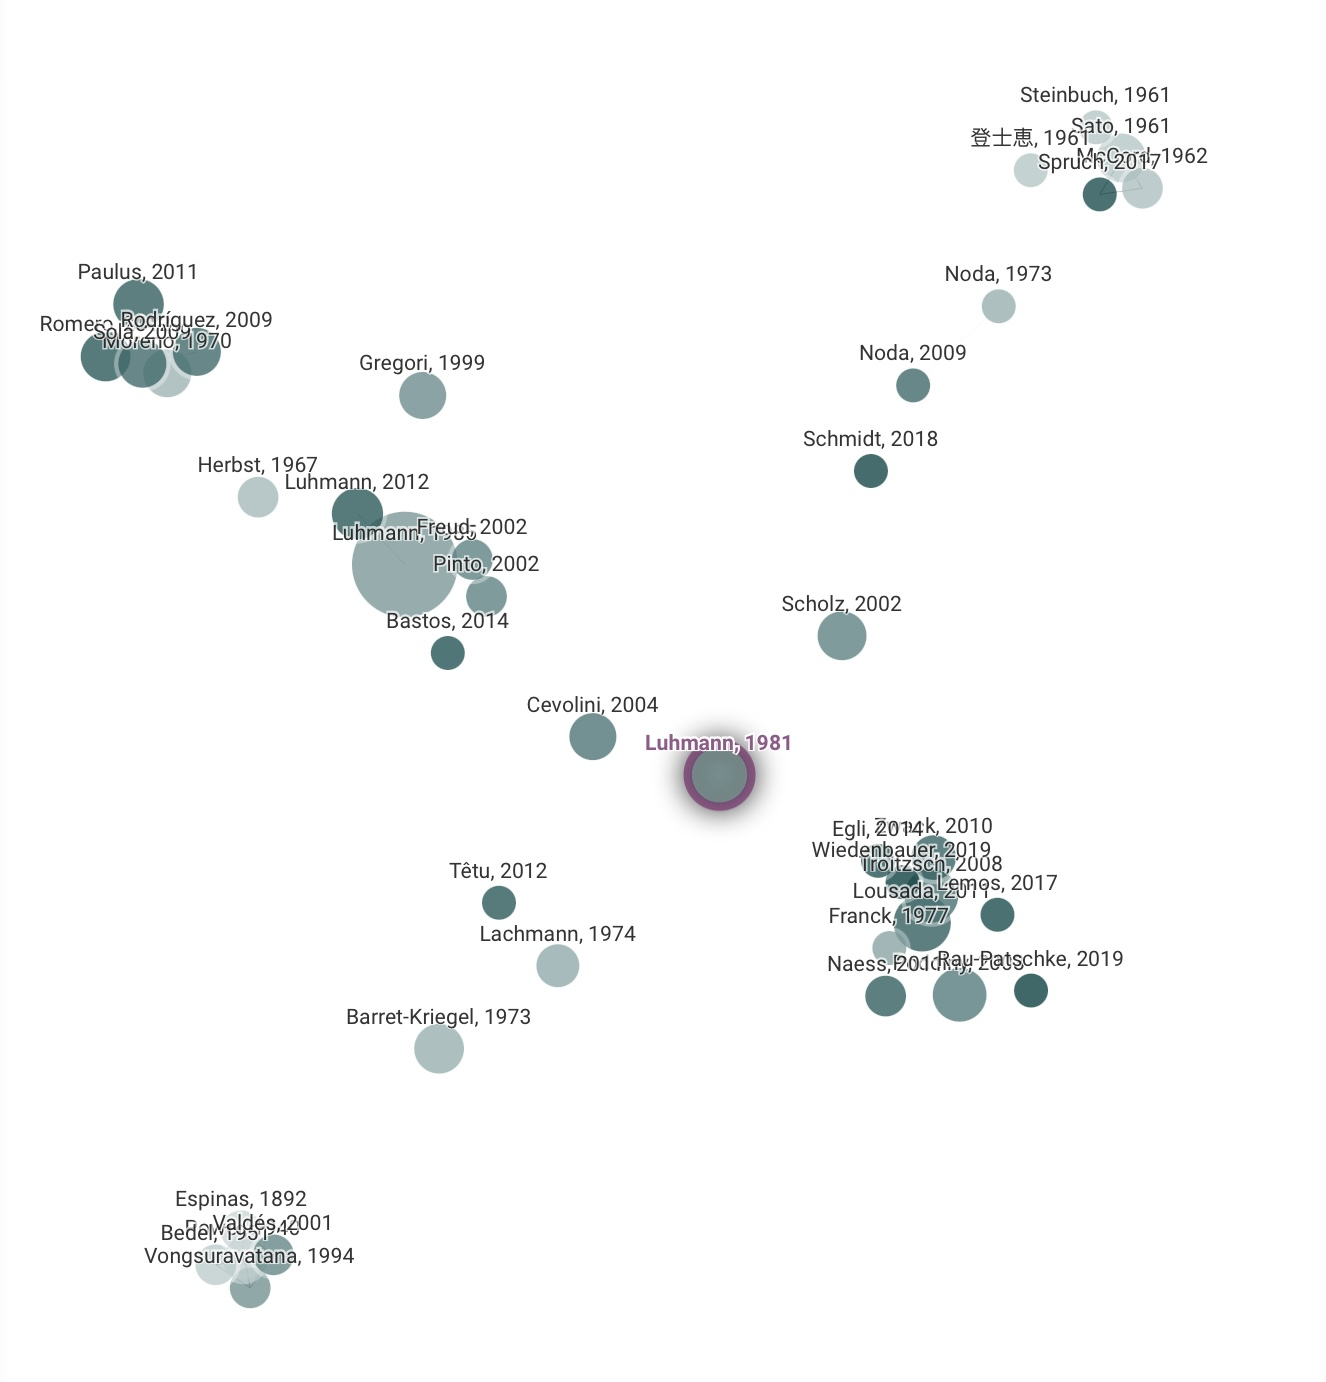
It’s an example from Connected Papers where color shows the year and size the number of citations.
I’m looking for a 1 tool. Graph View isn’t the perfect solution. There is no graphical representation for the year (color or time axis).
Edmund Gröpl — 100% organic thinking. Less than 5% AI-generated ideas.
@Will, thanks. I didn't understand your first sentence, so perhaps it was misstated. It seems to me that there is demand for subject indexing and recommender systems in the non-academic world; that's why public libraries have OPACs with subject headings and, these days, some even have built-in recommender systems. Also, in your second sentence, a citation index as Wikipedia defines it would also be third-party. I like what you did there with Research Rabbit.
@Andy, indeed I misspoke. I should have said, "There isn't much demand for citation indexes in the non-academic world, but there should be." Thinking about it more deeply, I see where a citation index would be considered a third-party source.
Will Simpson
My peak cognition is behind me. One day soon, I will read my last book, write my last note, eat my last meal, and kiss my sweetie for the last time.
My Internet Home — My Now Page
@Edmund said:
The Cita plugin for Zotero is supposed to have some kind of graph visualization, according to its README file.
I googled Cita + Zotero + plugin + visualization, and found the Zotero forum discussion "Graph visualization of related item in Zotero?" (2020), which says that Better BibTeX for Zotero (BBT) has a translator called "Citation graph" that can write citation relations into a Graphiz DOT file. (If I used Zotero, I would already use BBT anyway for citation keys.) Someone posted a link in that same discussion to a Zotero plugin called Better Notes for Zotero that syncs with Obsidian, implying that it is also relevant for creating a citation graph visualization, but it's not immediately clear to me how it's relevant. It could be worth investigating?
@Edmund, keep us updated with any other software like this that you find. I don't have a use for it now, but it's interesting.
@Andy said:
I should have noted: If you use BBT to export citation graph data from Zotero to a Graphviz DOT file, you can import that file into the graph visualization software Gephi, which gives many options for changing the appearance of the graph and interacting with it. You could probably do almost any kind of node–link representation in Gephi.
In a comment in the Zotero forum discussion "Representing citation trees in Zotero" (February 2024), someone pointed to the graph view feature in the Zotero Style plugin, which shows a graph view of Zotero's related items, but the graph is "rendered by Obsidian's source code", and so it has the limitations of Obsidian's graph view. And unfortunately, because the plugin uses Zotero's item relations, it would not support different types of relations between items. (The developer of the Cita plugin for Zotero, in contrast, is considering implementing support for citation types.) But the Zotero Style plugin shows how people like me who don't have reference notes could do an initial "graph view" of a citation network, like @Edmund's first step above, within the reference manager.
@Edmund said:
Well, I imagine that is why you did the further steps of creating your "concept map" and your "extended concept map with time axis" in your original post above: because the Obsidian graph view was not sufficient for your purpose of having "a good overview that facilitates the overall understanding of this bibliographic network".
I would say that both your "concept map" and your "extended concept map with time axis" (i.e., your literature maps) are types of structure note. They are not plain-text structure notes, obviously, but they are still structure notes because they arrange your reference notes into a structure. They are structure notes for your reference notes.
Ultimately, I suspect that the "perfect solution" (in the form of a ready-made software package) for literature mapping does not exist, as is often the reality in our search for knowledge-work tools. @ctietze's advice to "program yourself for productivity and stop searching for the ideal software" (in which he described "looking for the perfect visualizer, ending up with plain text") is as relevant as ever. Manually creating literature maps when necessary, just like we manually create other kinds of structure notes when necessary, seems to be a "good enough" solution to the problem that @Edmund was trying to solve. Automated graph views, while they can facilitate the initial step of creating such structure notes, are not necessary.
@Andy said:
and:
So I stopped searching and started drawing. I used the initial concept map from above with some simplification and a time axis from left to right. With quotes from the books some kind of storytelling is added:
Edmund Gröpl — 100% organic thinking. Less than 5% AI-generated ideas.
" Simplify the system by eliminating unnecessary elements. - John Maeda" [1]. Here's an alternative "Structure Note" created with the Obsidian Canvas plugin. Boxes are automatically linked with the related "Reference Notes":
It is also possible to embed this canvas in any other note. A resulting pictogram framing the canvas is displayed automatically:
Reference:
[1] Maeda, John. The laws of simplicity: design, technology, business, life. First MIT Press paperback edition, The MIT Press, 2020.
Edmund Gröpl — 100% organic thinking. Less than 5% AI-generated ideas.
@Edmund said:
This is great. It seems like such a natural way to do a literature map in Obsidian. It would not surprise me if a lot of people are already using Obsidian Canvas in this way for literature maps.
For someone who is doing a major literature review, having reference notes in the Zettelkasten like this, linked in a literature-map structure note, would be a good way to do it.
I don't have reference notes, so if I wanted to do a quick literature map like this, I would put BibTeX citation keys in the nodes. I use BibDesk, and these citation keys can either be directly hyperlinked with the
x-bdsk://URL scheme or opened with the system-wide "Show Reference With Cite Key" command, both of which open or reveal the corresponding item in the reference manager. Something similar probably exists for Zotero.By the way, I remembered that BibDesk allows users to specify custom "citation type" BibTeX fields with clickable citation keys, so in BibDesk you can already specify database fields for arbitrary citation types (like the "supporting" and "contrasting" types of citations in Scite.ai that I mentioned above).
I thought I was done searching for software, but then I wondered whether anyone had used the TeX graphics package TikZ to create literature maps. A web search turned up a Python-based software tool called ReViz (GitHub repo / paper / slides: see any of these links for examples of the graphical output). The creators call it "lightweight software for generating citation graphs", but it's a sophisticated software package suitable for systematic literature reviews. It generates TikZ code both for a citation graph with a time axis and for a flowchart showing the process of generating the citation graph, which is "so meta"!
Also, I happened to find the Reference Map Obsidian plugin, a plugin "that helps you manage and create/discover references and citations", because it was listed in a list of Obsidian plugins that also listed the Obsidian TikZJax plugin, which is used for rendering LaTeX and TikZ diagrams within notes in Obsidian.
Right, I think the easiest way to put it is how recommendation systems can still be improved for non-academic readers. Literature mapping in the way being explored in this thread is helpful to see the connections between literature. But most of the time, those connections don’t tell much more than the fact that they are connected. When we think of literature mapping as creating a graph with books as nodes and connections as edges, then we often go to great lengths to create decent nodes (as notes) but don’t contextualize edges as much. Now, I see a site like scite.ai already appears to do better on academic papers; the site distinguishes how the paper cite literature (in support of, in contrast to, etc.). That’s a good approach with academic papers and likely easier with the academic writing style. That’s where I see a potential for improvement in non-academic situations.
To my knowledge, the recommendation systems as used by online retailers only use consumer behavior, essentially coming down to tracking co-occurrences of page view, product purchase, or anything else made available by site analytics. That’s not quite useful or interesting enough for those seriously looking for contextualized reading suggestions. There are many different ways two literature materials are connected. I can imagine substantive comments about such connections being useful as reading suggestions. Once aggregated, they could inform recommender systems. They could seed a book comparison tool. At the very least, we can understand better how two books are mentioned together. The issue is that we mostly do this implicitly, so unlike abundant book reviews (nodes in the graph of literature mapping), the contextualized connections (edges in the graph) are not available or organized well enough to be useful. I’m wondering if there is a good approach to surface them.
Thanks for the list. This is very useful to keep for further exploration.
Another example of the use of a literature map in my Zettelkasten. It shows the most important sources that I have read on the subject of "Zettelkasten". The references are a personal excerpt from the bibliographies found in the sources. Quotations from the sources (notes from my Zettelkasten) are added to create a "readable map".
Edmund Gröpl — 100% organic thinking. Less than 5% AI-generated ideas.
@zettelsan said:
Above I made a parenthetical remark that the developer of the Cita plugin for Zotero is considering implementing support for citation types: in the linked GitHub issue, he mentions the Citation Typing Ontology, which is "an ontology for describing the nature of reference citations in scientific research articles and other scholarly works". To me, your remarks suggest that you want a knowledge graph of relations between non-academic publications, including an ontology of such relations (and, no doubt, a user-friendly interface for navigating and searching them).
The process of extracting a knowledge graph from unstructured and semi-structured data involves areas of computer science such as text mining, natural language processing, and graph mining. Library technologists are among the people who would know the most about this area as applied to literature.
One of Aaron Tay's blog posts listed above talks about this in the academic context: Graph based applications for academic discovery – Citation graphs, PID research graphs, Knowledge graphs and more. Tay mentions Wikidata as an important knowledge graph where many different organizations expose and link their metadata. Tay mentions a few online bibliographic services that are using knowledge graphs in interesting ways. Tay's post was published in 2020, so there may be more such services available now.
For example (my example, not Tay's), the Wikidata entry on George Orwell's dystopian novel Nineteen Eighty-Four can be viewed through various interfaces such as Reasonator (my favorite interface to Wikidata), SQID, or Scholia. The Wikidata entry on Nineteen Eighty-Four does not have data relevant to book recommendations, but there is no reason why it couldn't have such data, with an ontology as rich as one could wish. Look at the book recommendations in the LibraryThing entry for Nineteen Eighty-Four; Wikidata already includes the LibraryThing work ID for that book, and if all the LibraryThing data were open data, all of its book recommendations could be included as structured data in the Wikidata entry.
See Wikidata:Tools/Visualize data for many tools for visualizing data from Wikidata, including Wikidata Graph Builder.
I will try this--Zettlr does not render TiKZ diagrams, and I would prefer not to compile them with LaTeX to see them.
The bibliographic visualizations in this thread bring to mind a topic that some academics might be reluctant to acknowledge: the brutal academic market, the decline of humanities programs, the cost of education, and all-consuming, non-epistemic incentives to secure grant funding and produce more publications than ideas have created an intellectual vacuum within academia. Zettelkasten has filled this void for those outside or leaving academia.
GitHub. Erdős #2. Problems worthy of attack / prove their worth by hitting back. -- Piet Hein. Alter ego: Erel Dogg (not the first). CC BY-SA 4.0.
Interesting discussion. The problem with #2 at least for the common ones like ResearchRabbit, LitMap is the sources they rely on is that these sources are weak on books/monograph and is heavily article focused. For most academic disciplines other than humanities and to some extent social sciences this isn't an issue, but I suspect for most non-academic use this might be an issue.
As discussed things like Wikidata might help a little.
1 is what I guess this forum is about and people use things like Obsidian. Still, I wonder why can't 2 be a source you pull from and then you edit away the parts you don't like and/or add connections personal to you?
I also think that while general citation indexes may be helpful to get an initial overview within a particular field of research, their usefulness is limited. The problem is that links are drawn between entire publications without any information on what exact statements are being linked (aka cited).
With our Zettelkasten notes we’re one step further ahead as we’re creating links between individual (atomic) statements from these publications. And by adding context to a link (or by encoding the kind/nature of a link relationship via an explicit link type like “supports” or “rejects”) we can actually state why a link has been created between two of these statements. The latter adds another important level of granularity to your knowledge graph.
So instead of visualizing connections between entire publications, I think it’s better to visualize the (ideally typed) connections between actual statements from these publications, and have the graph group these individual statement notes by publication.
This level of granularity is usually not available via online databases but has to be built up by yourself. In the future, our software should help us to optionally export such individual knowledge graphs to services like Wikidata with a single click so that others can benefit from it.
@msteffens said:
Thanks, that's a very clear elaboration on what I meant when I said above: "In my notes, the concept of an argument map or issue map remains central" (rather than a literature map). I could have also used Joel Chan's term "discourse graph".
Of course, there are already services and software that make it quite easy to publish the "discourse graph" of one's Zettelkasten on the web: Roam Garden, Obsidian Publish, static site generators, etc.
For a more centralized service focused on displaying people's notes by publication, Zotero would be a natural foundation due to its existing infrastructure. Research Rabbit, for example, can already read and write publications to Zotero libraries. It would not be much of a leap to extend this to individual notes within Zotero. Perhaps something like this already exists, but I don't know of it. I also don't know whether there is much of a demand for this, unlike the widely used options mentioned in the previous paragraph.
EDIT: Hypothes.is is an existing platform that already displays people's notes by publication on the web. I don't know of any "graph view" for it, but it may be the web platform that is closest to what @msteffens suggested, minus link types. I have heard that it's possible to synchronize Hypothes.is notes with an Obsidian vault. If you were to do your source annotation in Hypothes.is, sync those notes to your local Zettelkasten for further processing, and publish your Zettelkasten elsewhere on the web using a tool that provides at least a local graph view (as some tools do), you would already have collective annotation of publications on a shared platform as well as your own public discourse graph.
Hi, Edmund,
I read your post and find this workflow really fascinating. However, I have a dumb question, what if I start to read my first book with Zettelkasten, then what do I need to do to make a literature map possible in the future.
Without a visual, the "Literature Map" would be a "Literature List".
Edmund Gröpl — 100% organic thinking. Less than 5% AI-generated ideas.